With gold under pressure this morning on the back of stronger stock markets, the strengthening US dollar and up-tick in US bond yields some focus on the primary US dollar gold price pressure factors is warranted. The primary gold bearish factors have been shifting in 2016, but are far from reversing. They include:
- Expectations of an extended Fed tightening cycle - The strong US dollar - Above average stock market returns - Low volatility (VIX)
Fed tightening remains the bias, not easing. The US dollar index has declined, but is holding good support near the 2015 lows at 93. The stock market has shown some cracks in the bullish trend, but is currently up slightly in 2016, as measured by the 1% increase in the S&P 500. The VIX volatility index is down 10% on the year near 14 last, compared to 18 at the end of 2015. Has the gold price jumped ahead some? Maybe, as gold has backed away from good resistance at $1,300/oz. Or, is gold just in the early recovery stages from an extreme oversold condition and attractive relative investment value levels, now looking ahead for the key bearish factors to reverse?
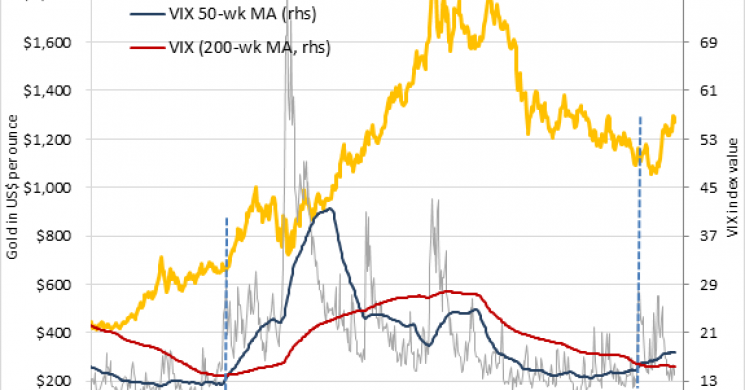
VIX Focus - Is it shifting higher? Gold is often referred to as the reciprocal of the US dollar. With the US Dollar Index down about 5% this year, it makes sense that the US dollar price of gold has recovered. How about volatility? The price of gold has had a tendency to move coincident with overall market volatility, acting as a safe haven. The VIX index is the most widely watched global measure of volatility and it has been quite low in recent years. About 19 is the VIX historical average. The VIX ended Wednesday at 14, which is the average from 2013 thru 2014. One key factor in options trading is volatility is always mean reverting. Periods of very low volatility are often followed by periods of high volatility, and vise versa. The most recent historic example of very low volatility followed by very high volatility was the extended period of about 5-months from November 2006 through February 2007, when the VIX index averaged near 11, just prior to the 2008 crisis. Following this extended period of low volatility, the VIX 50-week moving average (MA) crossed back above the 200-week MA in August of 2007, ironically about a year before the Lehman bankruptcy (featured chart). Since 2010, the VIX 50-week MA has remained below the 200-week MA. That is, until September of last year. Indicating a potential reversal in the low volatility trend, the VIX 50-week MA has crossed back above the 200-week MA last September. Hopefully, we will not see a similar increase in volatility as the 2008 crisis, but prudent investors should probably heed the warning.
The VIX appears to be recovering, following an extended period of low volatility

Special Contributor to Kitco News Mike McGlone Newsfeedback@kitco.com
Read more by MarketSlant Editor


