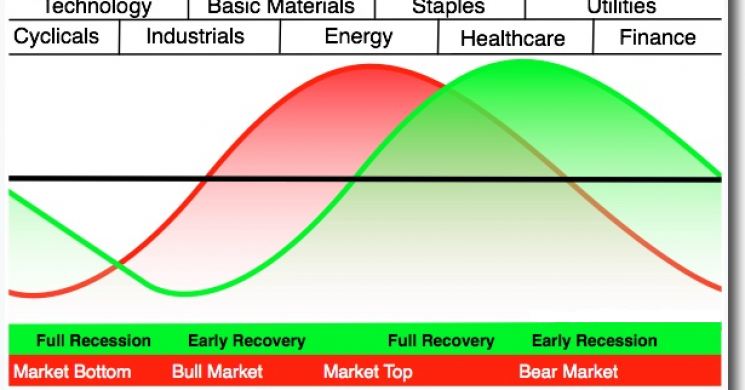
Our team of researchers continues to attempt to identify market strengths and weakness in the US major markets by identifying key, underlying factors of the markets and how they relate to one another.
Recently, we’ve been warning of a potentially explosive bullish move in Metals and our last article highlighted the weakness in the Transportation Index as it relates to the US major markets. On November 2, 2017, we warned that the NQ volatility would be excessive and that any move near or below 6200 would likely prompt support to drive prices higher as our Adaptive Dynamic Learning model was showing wide volatility and the potential for rotation moves.
This week, we are attempting to highlight a potential move in Bitcoin that could disrupt the global economy and more traditional investment vehicles. For the past few years, Bitcoin has been on a terror to the upside. Recently, a 30% downside price rotation caused a bit of panic in the Crypto world. This -30% decline was fast and left some people wondering what could happen if something deeper were to happen – where would Crypto’s find a bottom. From that -30% low, Bitcoin has recovered to previous highs (near $8000) and have stalled – interesting.
While discussing Bitcoin with some associates a while back, I heard rumor that a move to Bitcoin CASH was underway and that Bitcoin would collapse as some point in the near future. The people I was meeting with were very well connected in this field and were warning me to alert me in case I had any Bitcoin holdings (which I do). I found it interesting that these people were moving into the Bitcoin CASH market as fast as they could. What did they know that I didn’t know and how could any potential Bitcoin blowout drive the global markets?
Panic breads fear and fear drives the markets (fear or greed). If Bitcoin were to increase volatility beyond the most recent move (-30% in 4 days) – what could happen to the Crypto markets if a bubble collapse or fundamental collapse happened?

How would the major markets react to a Crypto market collapse that destroyed billions in capital? For this, we try to rely on our modeling systems and our understanding of the major markets. Let’s get started by looking at the NASDAQ with two modeling systems (the Fibonacci Price Modeling System and the Adaptive Dynamic Learning system).
This first chart is a Daily Adaptive Dynamic Learning (ADL) model representation of what this modeling system believes will be the highest probability outcome of price going forward 20 days. Notice that we are asking it to show use what it believes will happen from last week’s trading activity (ignoring anything prior). This provides us the most recent and relevant data to review.
We can see from the “range lines” (the red and green price range levels shown on the chart), that upside price range is rather limited to recent highs whereas downside prices swing lower (to near 6200 and below) rather quickly. Additionally, the highest probability price moves indicate that we could see some downside price rotation over the Thanksgiving week followed by a retest of recent high price levels throughout the end of November.

This NQ Weekly chart, below, is showing our Fibonacci price modeling system and the fact that we are currently in an extended bullish run that, so far, shows no signs of stalling. The Fibonacci Price Breach Level (the red line near the right side of the chart) is showing us that we should be paying attention to the 6075 level for any confirmation of a bearish trend reversal. Notice how that aligns with the blue projected downside support level (projected into future price levels). Overall, for the NQ or the US majors to show any signs of major weakness, these Fibonacci levels would have to be tested and breached. Until that happens, expect continued overall moderate bullish price activity. When it happens, look out below.

The next charts we are going to review are the Metals markets (Gold and Silver). Currently, an interesting setup is happening with Silver. It appears to show that volatility in the Silver market will be potentially much greater than the volatility in the Gold market. This would indicate that Silver would be the metal to watch going into and through the end of this year. This first chart is showing the ADL modeling system and highlighting the volatility and price predictions that are present in the Silver market. Pay attention to the facts that ranges and price projections are rather stable till about 15 days out – that’s when we are seeing a massive upside potential in Silver.

This next chart is the Fibonacci Price Modeling system on a Weekly Silver chart. What is important here is the recent price rotation that has setup the Fibonacci Price Breach trigger to the upside (currently). This move is telling us that as long as price stays above $16.89 on a Weekly closing price basis, then Silver should attempt to push higher and higher over time. The projected target levels are $19.50, $20.25 and $21.45. Notice any similarity in price levels between the Fibonacci analysis and the ADL analysis? Yes, that $16.89 level is clearly identified as price range support by the ADL modeling system (the red price range expectation lines).

How will this playout in our opinion with Bitcoin potentially rotating lower off this double top while the metals appear to be basing and potentially reacting to fear in the market? Allow us to explain what we believe will be the most likely pathway forward…
At first, this holiday week in the US, the markets will be quiet and not show many signs of anything. Just another holiday week in the US with the markets mostly moderately bullish – almost on auto-pilot for the holidays. Then closing in on the end of November, we could start to see some increased volatility and price rotation in the metals and the US majors. If Bitcoin has moved by this time, we would expect that it would be setting up a rotational low above the -30% lows recently set. In other words, Bitcoin would likely fall 8~15% on rotation, then stall before attempting any further downside moves.
By the end of November, we expect the US markets to have begun a price pattern formation that indicates sideways/stalling price activity moving into the end of this year. This ADL Daily ES Chart clearly shows what is predicted going forward 20 days with price rotating near current highs for a few days before settling lower (near 2540~2550 through early Christmas 2017). The ADL projected highs are not much higher than recent high price levels, therefore we do not expect the ES to attempt to push much higher than 2595 in the immediate future. It might try to test this level or rotate a bit higher as a washout high, but our analysis shows that prices should be settling into complacency for the next week or two while settling near the lower range of recent price activity.

What you should take away from this analysis is the following : don’t expect any massive upside moves between now and the end of the year that last longer than a few days. Don’t expect the markets to rocket higher unless there is some unexpected positive news from somewhere that changes the current expectations. Expect Silver to begin to move higher in early December as well as expect Gold to follow Silver. We believe Silver is the metal to watch as it will likely be the most volatile and drive the metals move. Expect the major markets to be quiet through the Thanksgiving week with a potential for moderate bullish price activity before settling into a complacent retracement mode through the end of November and early December.
If Bitcoin does what we expect by creating a rotational lower price breakout setup from recent highs, we’ll know within a week or two. If this $8000 level holds as resistance, then we will clearly see Bitcoin rotate into a defensive market pattern (a flag formation or some other harmonic pattern above support). The US majors will likely follow this move as a broader fear could begin gripping the markets.
Lastly, as we mentioned last week, pay very close attention to the Transportation Index and it’s ability to find/hold support. Unless the Transportation index finds some level of support and begins a new bullish trend, we could be in for a more dramatic move early next year. Our last article clearly laid out our concerns regarding the Transportation Index and the broader market cycles. All of our analysis should be taken as segments of a much larger market picture. We are setting up for an interesting holiday season where the market could turn in an instant on fear or news of some global event (like a Bitcoin collapse). The volatility we are seeing our modeling systems predict is increasing (especially in the Silver market over the next few weeks). We could be headed for a bumpy ride with a classic top formation setting up.

Overall, protect your investments and your long positions. Many people will be away from their PCs and away from the markets over the holidays. It is important that you understand the risks that continue to play out in the markets. Pay attention to market sectors that are at risk of showing us greater fear or weakness in the major markets. Pay attention to these increases in volatility and price rotation. Most of all, pay attention to the market’s failure to move higher over this holiday season because we should be traditionally expecting the Christmas Rally to push equities moderately higher at this time.
Should we see any more clear signs of weakness or market rotation, you will know about it with our regular updates to the public. If you want to know how AcitveTradingPartners.com can assist you in staying up to day with the market cycles and analysis, then visit www.ActiveTradingPartners.com and learn how we can assist you with detailed market research, daily updates, trading signals and more. We are dedicated to helping you achieve success in the markets and do our best to make sure you are prepared for any future market moves. See how we can assist you now and in 2018 to achieve greater success.
Chris Vermeulen


