GOLD
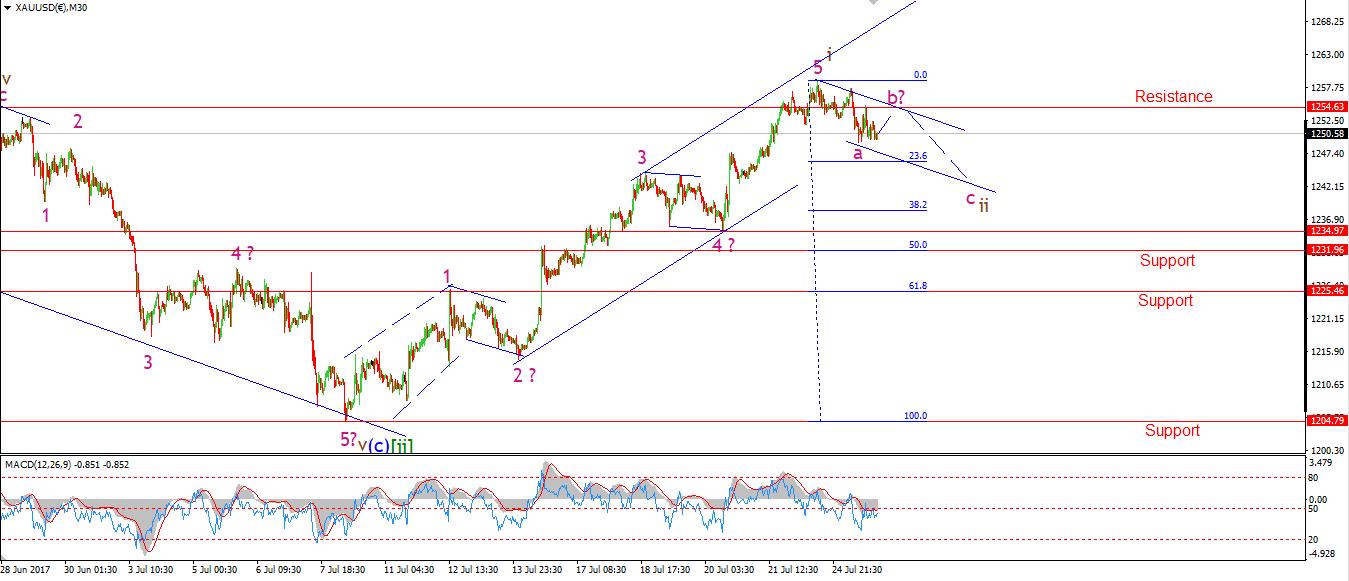
30 min
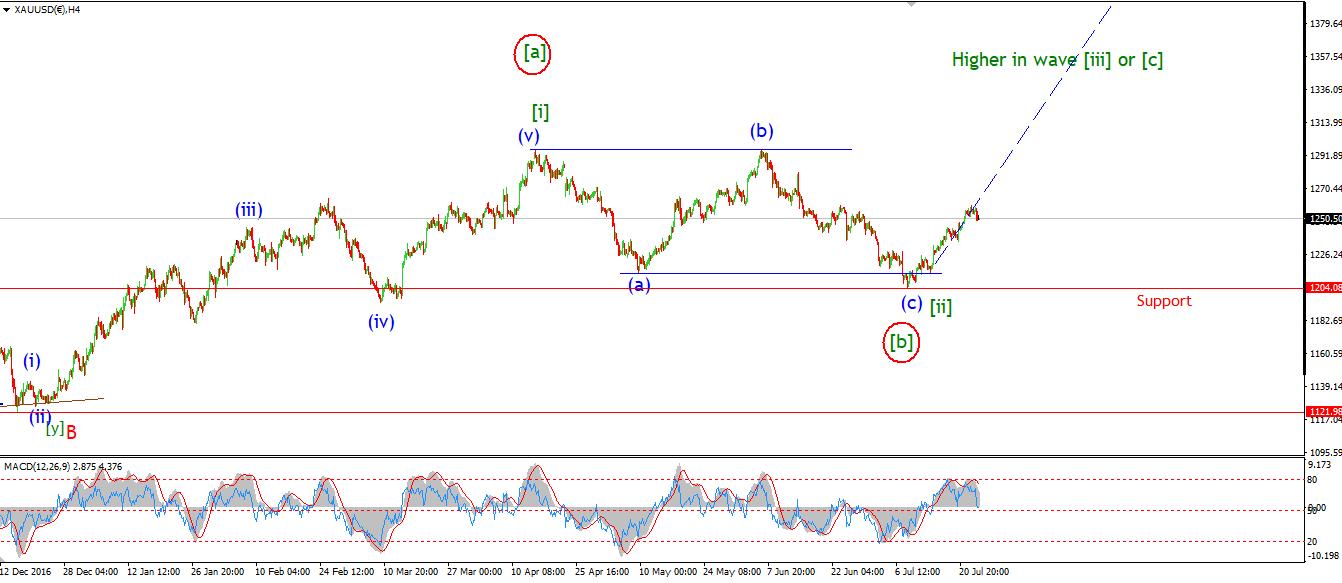
4 Hours
Daily
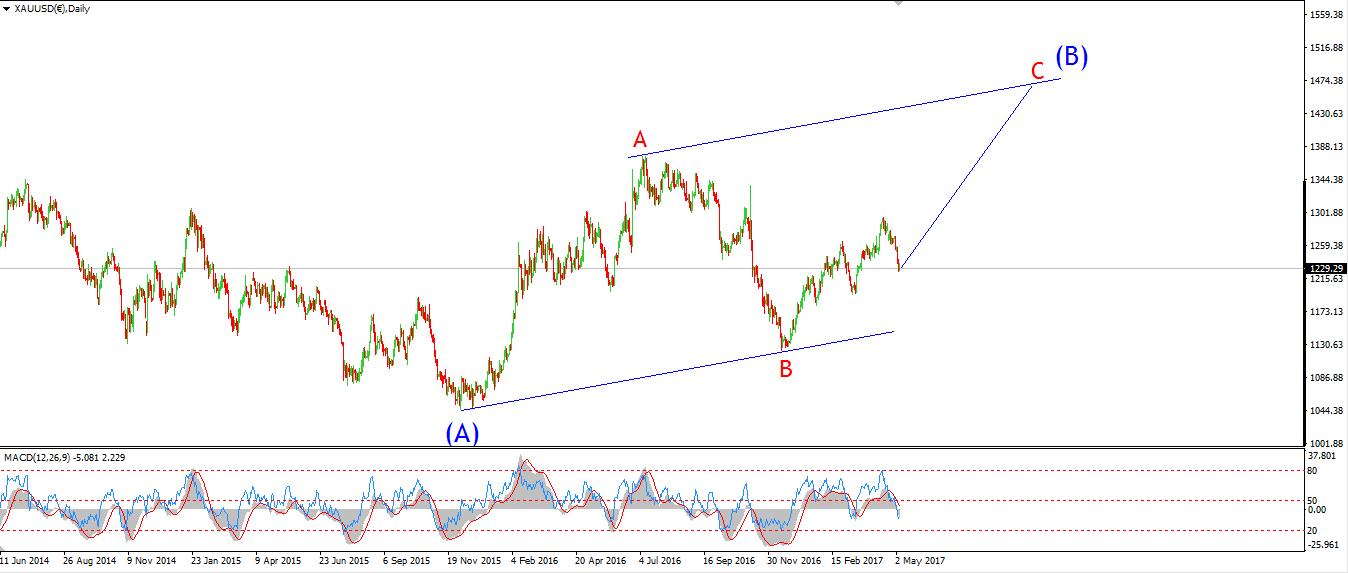
My Bias: Long towards 1550 Wave Structure: ZigZag correction to the upside. Long term wave count: Topping in wave (B) at 1550 Important risk events: USD: New Home Sales, Crude Oil Inventories, FOMC Statement, Federal Funds Rate.
GOLD began its decline into a possible wave 'ii' brown today. The declines look corrective so far so the overall interpretation remains the same.
I have labelled the initial decline off the high as wave 'a' pink. Wave 'b' pink could be underway as I write, and wave 'c' should follow. The decline so far looks like it could be the start of a flat correction. This would trace out a 3,3,5 internal structure.
The previous fourth wave low of one lesser degree lies at 1234.97. 1231.96 is the 50% retracement level. This is a nice cluster of support and forms the likely target for wave 'ii' brown.
One measure of sentiment I follow Is the 'daily Sentiment index' This index is compiled by tradefutures.com. The index is now rising off an extreme low of 14% bulls among futures traders, which was registered last week. Another sure sign that the market is turning up now in a big way!
In fact, the more I look at the larger price structure, the more I think that 1550 is a minimum target, this rally may well take out the all time high if my hunch proves correct and the market begins a new impulse wave rather that a large degree correction.
For tomorrow; Watch for a continued decline in wave 'c' pink to complete a three wave correction. once wave 'ii' is complete, we will have another bullish Elliott wave signal in place.
USDJPY
30 min
4 Hours
Daily
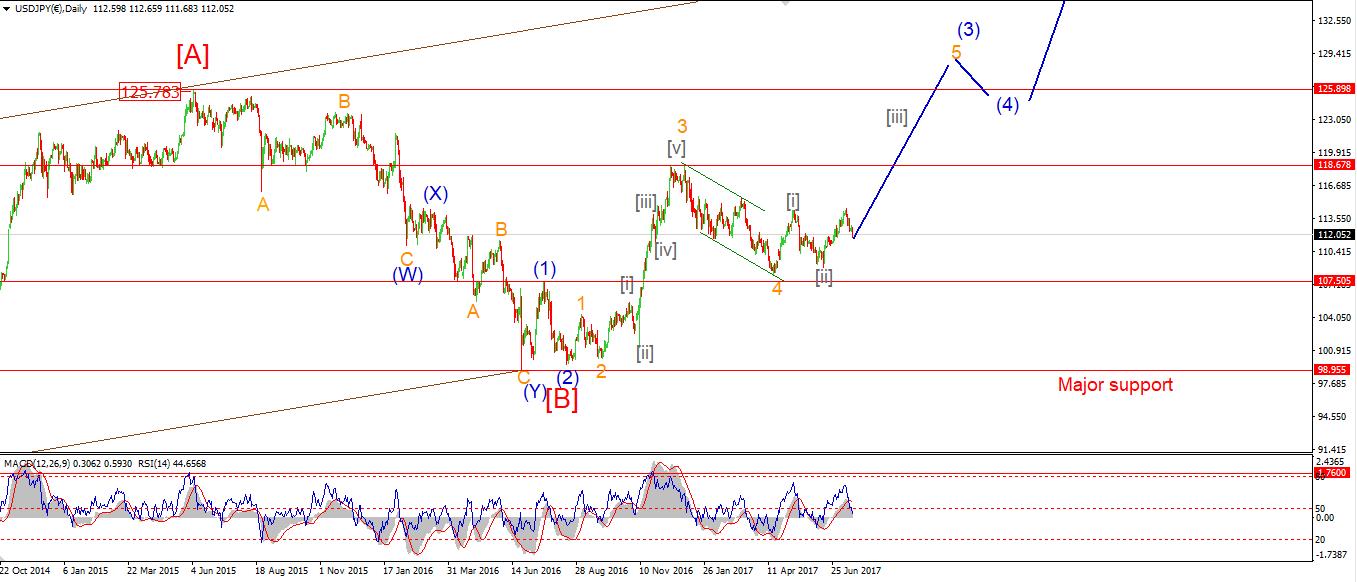
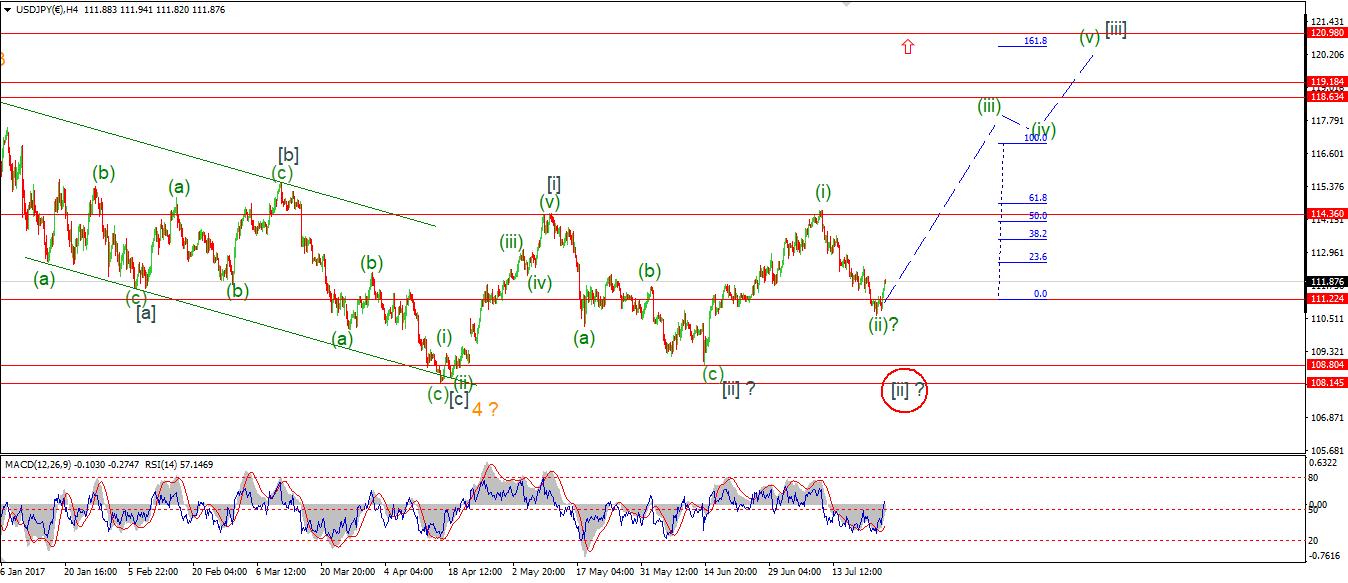
My Bias: LONG Wave Structure: rally in wave [C] Long term wave count: wave [C] is underway, upside to above 136.00 Important risk events: JPY: n/a. USD: New Home Sales, Crude Oil Inventories, FOMC Statement, Federal Funds Rate.
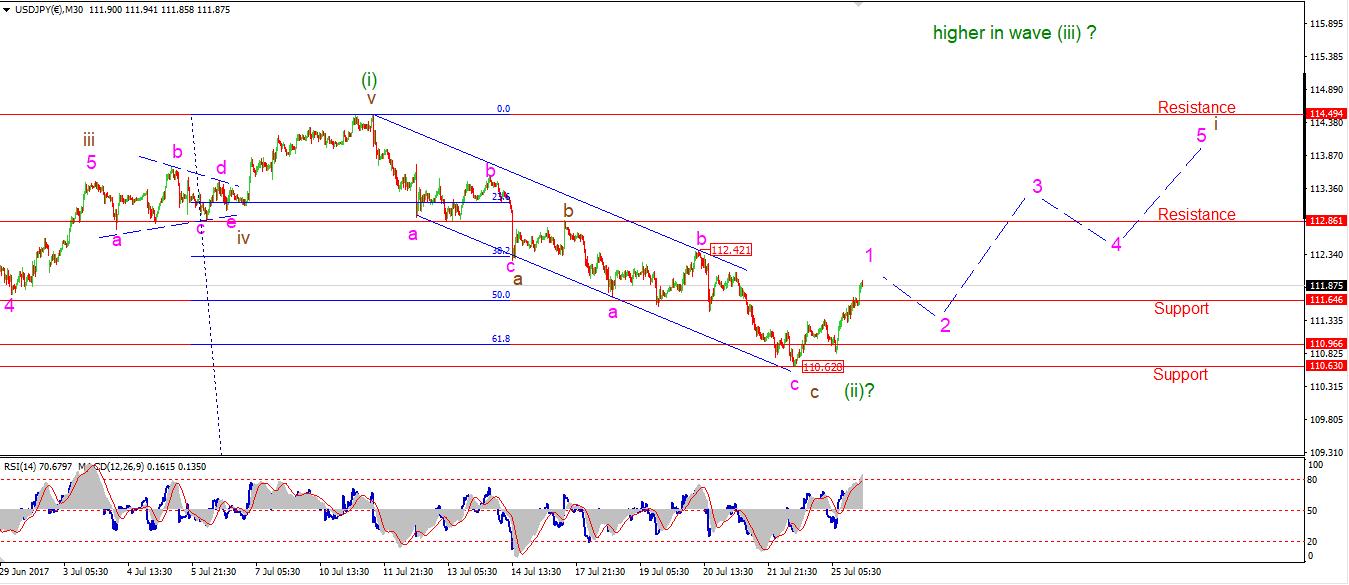
The short term action in USDJPY was very encouraging today. The price continued to rise impulsively off the recent low, and broke back up through the 50% retracement level at 111.64, all positive signs so far.
The price structure is tracing out a possible wave '1' pink and it is beginning to look like a five wave form on the very short term charts. If the current rise breaks 112.42, That will help the bullish case immensely from here.
For tomorrow; As usual, We await a bullish Elliott wave signal off the recent low in the form of 5 waves in the direction of the trend, and 3 waves against.
DOW JONES INDUSTRIALS
30 min

4 Hours
Daily
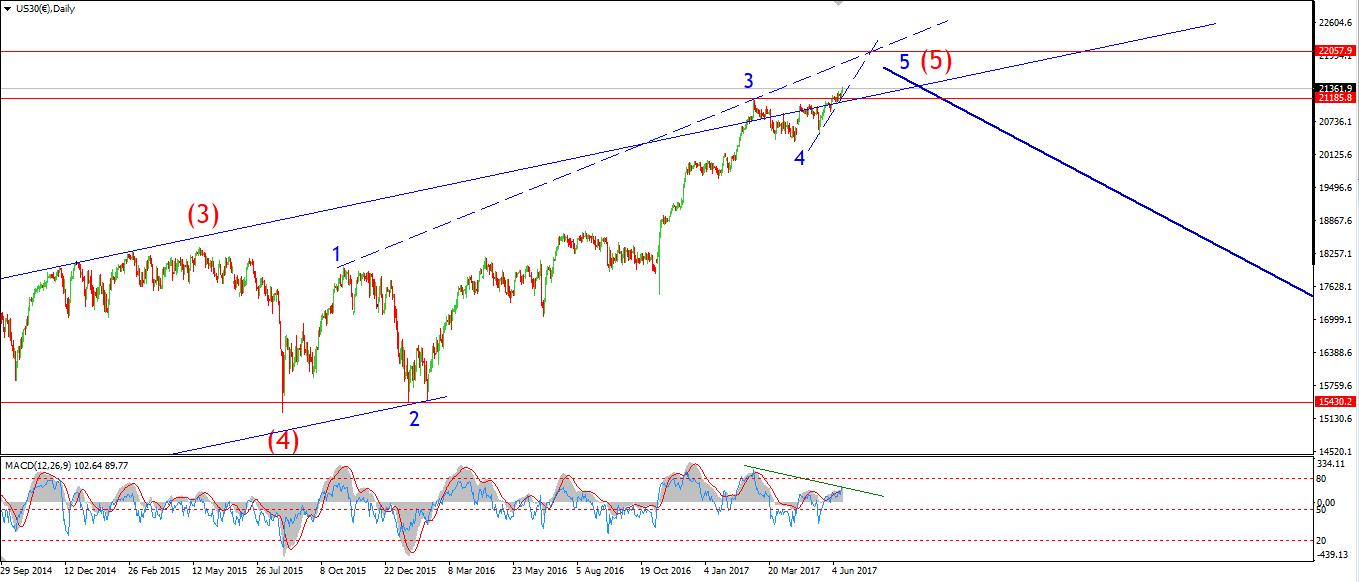
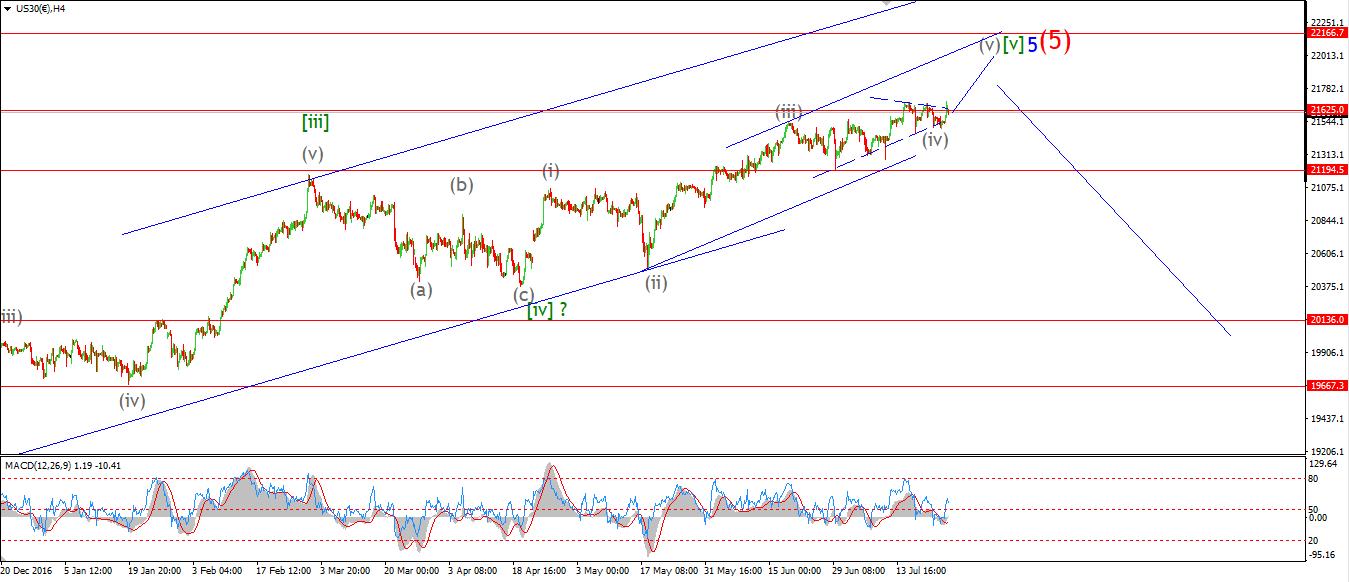
My Bias: market topping process ongoing Wave Structure: Impulsive 5 wave structure, possibly topping in an all time high. Long term wave count: Topping in wave (5) Important risk events: USD: New Home Sales, Crude Oil Inventories, FOMC Statement, Federal Funds Rate.
The DOW rallied about 150 points today to a new all time high, And then came an immediate decline to begin a possible wave 'ii' pink.
I have shown a three wave structure underway in wave 'ii' pink off the recent high. The interim low was at 21574 today, So a three wave decline in wave 'ii' pink should finish at or just below that level tomorrow.
A further break above 21655 will likely signal wave 'iii' pink has begun. The 4hr RSI broke above the centreline again today in a final bullish signal for this rally.
On a side note:
I have noticed that President Trump has referenced the recurring stock market highs as a direct resultant of the new administrations policies. I would advise against taking credit for the bull market. Because you may well be held accountable for bear market to come!
If wave 'ii' completes tomorrow, then we can expect wave 'iii' to break out to new all time highs again before the week is out. The initial target for wave 'iii' pink lies in the region of 21877, This is a Fibonacci 161.8% projection of wave 'i' pink off the wave 'ii' low.
For tomorrow; Watch for wave 'ii' to complete in the region of 21550. And for wave 'iii' to begin from there.
Read more by Enda Glynn