A lot of time and energy is put into figuring out how the market got to where it currently is, and where it is going next. That is not an easy question to answer by any means. The cool thing about difficult problems, with no seemingly straight-forward answer, is that the answer is usually right in your face and you simply cannot see it because you are human. Generally speaking, humans have evolved such that, they are used to making things more complex than they are or have to be. I’m guilty of it and so is anyone reading this - it's just human to do so.
Making mountains out of mole-hills is easily found with respect to capital markets. I won’t even go into the realm of academia’s nonsensical everything when it comes to capital markets and how an economy actually works. At any rate, there are many that use a plethora of technical indicators ad infinitum to gain an “edge.” As easy as that approach might seem, it simply lends itself to analysis paralysis at best. There is a simpler approach that only requires us to understand ratios.
It is too easy to forget that there are the steps involved in the purchase or sale of any item. Whether it is a piece of candy at the corner store or a mansion on the beach, the process of acquiring an asset is the same. Simply because we find ourselves sitting behind a screen clicking buttons does not mean that the procedure of buying and selling changes. It does not, and this is the key.
When you buy anything, you are exchanging something of perceived value for a good or service. When you buy or sell an exchange-traded product (a product that trades on an organized exchange), the process is the same. Therefore, from a long position’s point of view, if x hedge fund buys y asset from z asset manager, a swap of fiat money for an asset occurs. The buyer is acquiring the asset, and the seller is acquiring the cash, and vice versa if we take a short position’s point of view. Comprehending that fact is critical in grasping how markets, not only move but, how you can spot the oncoming move beforehand with some level of certainty after sometime.
 USDCAD versus Spot Crude Oil - Weekly, www.tradingview.com
The chart above shows two data points; we have monthly bars for Spot Crude Oil and candles for the USDCAD currency pair. Our focus will lie inside of the red boxes on the chart, which are turning points. Within each respective turning point, we can see something interesting if we look long enough. Odds are that upon breaking down said monthly chart into weekly and perhaps even daily time frames, we can see each transition area more clearly.
USDCAD versus Spot Crude Oil - Weekly, www.tradingview.com
Above we have a weekly version of the first chart, while focused on the first transition area in the monthly chart – for the years 1998 through early 2000. At point A, we can see how the USDCAD tops out on 8/24/1998, while crude only makes a local bottom at point B. USDCAD tops out 15 weeks before crude bottoms out on 12/7/1998.
In other words, market participants stopped liquidating the commodity, crude, for cash, via the USDCAD currency pair. This is why the currency pair was moving higher. The USD was being purchased while the CAD was being sold along with the crude, hence, why it is one of the commodity currencies. Note the percentage moves after point B, were 20% for crude and 6.5% for USDCAD. Not too shabby, and once you wrap your head around how markets actually work, it is not hard to track returns like these down.
The reason why I can make such a claim is simply because I have determined who the players on the field are. If you know who’s on the field, then you can determine what the rules are simply by looking at historical price patterns, as well as historical positioning data. How can you play a game to win without knowing the rules? You are set up for failure if you don’t know the rules. This is why trading has such a steep learning curve. I digress.
The overarching realization that must be made is that markets are like any other structure. We have the foundation, the plumbing and finally the structure. What we’re concerned with is the plumbing – the seemingly invisible part. In order for what I detailed above to be true, we must recognize at least two things. First, recognize that markets are all relative functions of each other. That is, markets can be valued with respect to currencies or other valued assets. Any asset can be denominated in any other asset. You can price SPX in crude, for example. As of Friday's close, you can get 49.4 SPX Indices for every 1000 barrels of oil. It is a simple ratio calculation. The SPX Index as you know it is simply the Index priced in USDs. Do I hear light bulbs turning on?
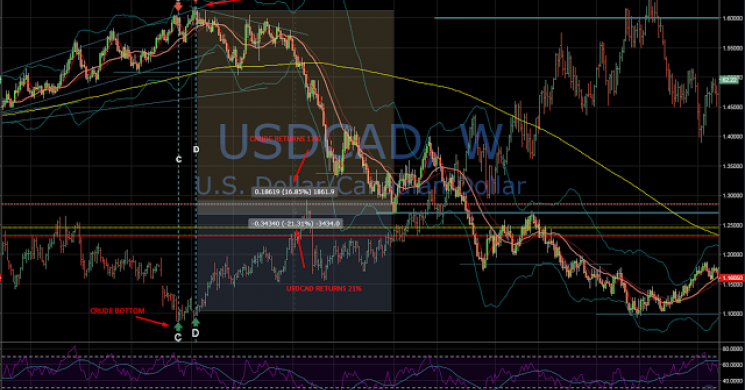
USDCAD versus Spot Crude Oil - Weekly, www.tradingview.com
In the above chart, we have points C and D. Point C highlights the crude bottom, while point D represents the USDCAD top. Keep in mind that this is a new rotation, beginning on 11/19/2001 and ending on 1/21/2002, which is when USDCAD found the top. An inverse rotation was representative in the market, as you would expect, prior to the one being initiated after point D. Finding the proper start and end to the rational occurrence before point D will be left for you to determine, as practice makes perfect if you’re so inclined. I intended to discuss the last couple of transition areas as well but I am nearing 1000 words and feel that you can do this by yourselves at this point. Practice makes perfect!
Read more by MarketSlant Editor


