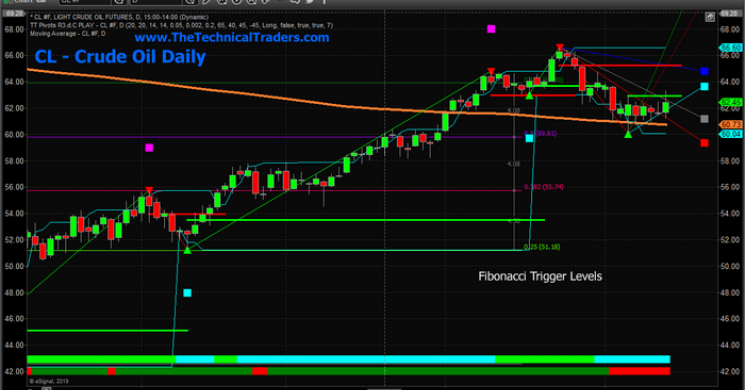
Crude Oil recently rallied up to the $63 level and failed. This level is a key Fibonacci price level based on our proprietary adaptive Fibonacci price modeling system. It represents a Fibonacci Long Trigger Level that would suggest that a new bullish price trend could setup if and when the price of Crude Oil rallies and closes above this level.
The fact that Crude Oil rallied above this level early on Monday, May 13, and failed to hold above this level suggests this is a failed price rally and a failed attempt to rotate higher. The failure of this price move suggests that Crude Oil may fall below current support, near $61, and begin a new downside price leg over the next 10+ trading sessions.
This Daily Crude Oil chart highlights the narrow price range, between $61 and $64.75, where a range of support and resistance levels are found with our proprietary Fibonacci modeling system. The fact that this failed price rally cleared the $63 level, then fell sharply afterward suggests that support for any upside price rally in Crude Oil is very weak. We would expect the price to rotate lower and retest the $61 level before breaking this level and moving much lower to find ultimate support.

We continue to attempt to reinforce one basic Fibonacci theory price rule for all of our followers to understand: Price must ALWAYS attempt to establish new price highs or new price lows at ALL TIMES.
We want to continue to push this message out to our followers so they can begin to understand how this price theory rule actually works in real-time application. This failed attempt to break the Bullish Fibonacci price trigger level is/was an attempt to establish a new price high. Failure to establish this new price high suggests that price will attempt to establish a new price low.
This weekly Crude Oil chart highlights the key Fibonacci trigger price levels that are located in a very narrow range near $63.25. The failed move higher, suggests a new price low will be attempted and ultimate support is currently near the $52.25 level.

With the US/China trade new still hitting the news cycles, we expect some extended volatility in the markets as well as currency price fluctuations in an attempt to mitigate the trade/stock market volatility/pricing. Additionally, we expect commodity price levels to come under continued pressure for two main reasons: A. the US Presidential election cycle continue to draw attention away from economic activity, and B. the global economy is already showing signs of economic and manufacturing weakness. This US/China trade issue will certainly put more pressure on commodity prices while creating a renewed level of FEAR in the markets.
As we've been warning everyone for the past 5+ months – get ready for some really big moves in 2019 and 2020. This type of market is a skilled traders dream come true. Big moves, big rotations, and big profits. Also, if you have not read our Recent Gold Bottom article be sure to read that now.
This is proving to be an incredible trading year for traders who follow our trade alerts newsletter.
Chris Vermeulen


