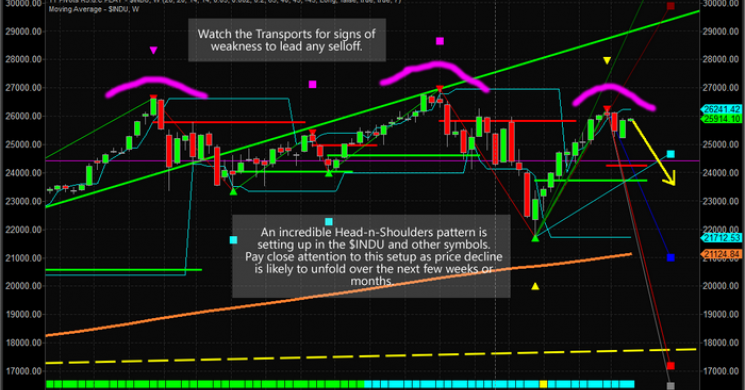
Our research team believes a moderately mild price rotation will unfold over the next 30 to 60 days where the US Stock Market will rotate downward. Particularly, the $INDU (Dow Jones Industrials) should move lower towards the $23,000 to 24,000 before finding support based on the longer term weekly chart. Keep in mind we are not saying the price is going to fall. We are stating price could correct in a big way if recent support levels are broken. If so, then 23,000-24,000 levels should be reviewed.
We have been warning about a specific price pattern that we believe is currently in the process of setting up in the US Stock Market. This pattern is a “Falling Wedge” pattern. We've seen a few of these over the past 5+ years in downward retracing price swings. They typically act as a means for the price to explore a “momentum base” setup before breaking out to the upside. You can read our previous research here.
Price weakness could begin to drive market prices lower over the next few weeks as this right Shoulder acts as critical resistance. If you have not already prepared for this move, please try to understand the importance of this long term price pattern. Head-n-Shoulders patterns are typically viewed as major resistance and a classic topping formation. Our belief that the downside price swing from the right Shoulder is based on our predictive modeling systems results. We believe this move will drive prices lower before support is found and our downward sloping wedge pattern sets up. This wedge pattern will likely break to the upside during the Summer months.
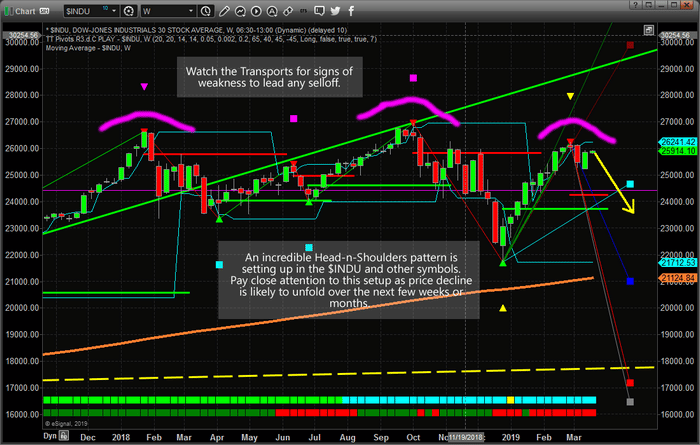
This Head-n-Shoulders pattern is something all traders need to pay attention to. This is a critical resistance/top formation that should drive prices lower over the next few weeks/months. If you have not protected your long trades well enough or you have recently deployed a bunch of capital into the markets, we strongly suggest you develop a “Plan B” as we are likely to see a 5~10% correction before this downside swing is over.
Our team has 53 years of experience in researching and trading makes analyzing the complex and ever-changing financial markets a natural process. We have a simple and highly effective way to provide our customers with the most convenient, accurate, and timely market forecasts available today. Our stock and ETF trading alerts are readily available through our exclusive membership service via email and SMS text. Our newsletter, Technical Trading Mastery book, and 3 Hour Trading Video Course are designed for both traders and investors. Also, some of our strategies have been fully automated for the ultimate trading experience.
RECENT CLOSED TRADES
Chris Vermeulen Technical Traders Ltd.
Read more by TheTechTrader


