Counting down the LAST DAYS of the bull-market, at FIVE degrees of trend!
DOW JONES INDUSTRIALS
30 min
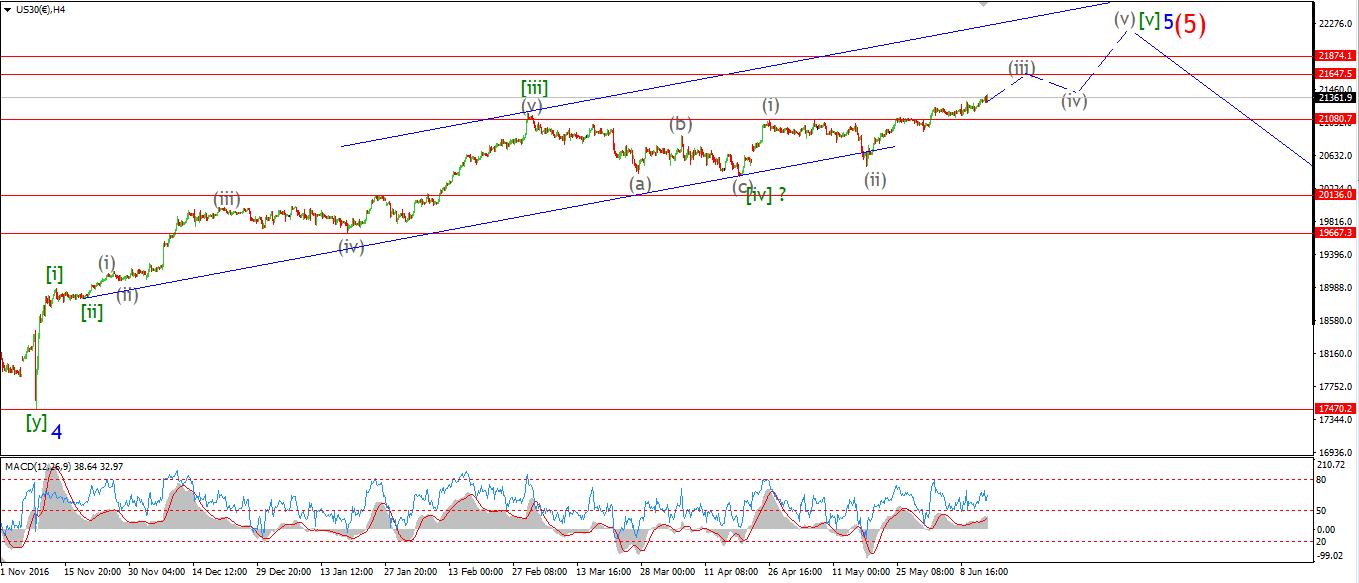
4 Hours
Daily
My Bias: market topping process ongoing Wave Structure: Impulsive 5 wave structure, possibly topping in an all time high. Long term wave count: Topping in wave (5) Important risk events: USD: Unemployment Claims, Empire State Manufacturing Index.
The DOW again broke new highs today. And with that new high comes my final interpretation of what is happening in this market!
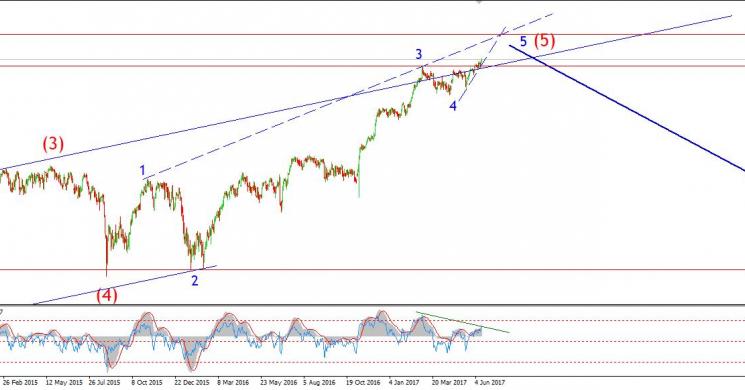
I have reassessed the whole wave structure off the 2015 lows. And I think it best counts as a completing five wave structure labelled in blue on the daily chart. we are now in the closing stages of wave '5' blue.
On the 4hr chart, wave '5' blue breaks down into a five wave structure labelled in green. The market is currently over half way through wave [v] green. With a possible upper target at 21874 to complete.
On the hourly chart I have shown wave [v] green broken down into a five wave form labelled in grey. The price is currently moving in wave (iv) grey. Wave (iv) grey looks to be an expanded flat correction, waves 'a' and 'b' are complete and wave 'c' is left.
This wave count projects a lower target for wave (v) grey, Somewhere in the region of 21500. Where the price would once more reach that rising trend line connecting the recent major highs.
In this wave count, the high at 21068 gains a significant importance. As it is the high of wave (i) grey, The price should not cross below that level before completing wave (iv) grey.
So, as it stands, the wave structure is closing out at a major degree, with only very little room left to the upside to complete. And a whole lot of empty space below us just begging to be filled!
For the next few days, Watch for a decline within wave 'c' pink,
Read more by Enda Glynn


