Recently, lots of news items have been discussing the run in the US equity markets and “how long can it go on like this?”. Our analysis of the markets shows us that many of these industry analysts are failing to consider one very important factor in much of their results. We wanted to share this with you through our own analysis so you have a clear picture in your head regarding the potential for US equities.
In our opinion, most of the industry leading analysts are developing conclusions based on Keynesian models that fail to adjust to recent disruptions in the global markets. Keynesian theory is focused on aggregate demand and the variations of this demand factor through normal and recession/depression economic events. In simple terms, as economies falter, Keynes suggested demand would suffer as a result of constrictions within the overall economy as a natural factor. His theories were radically opposed to those of the times (early 1900s) and proposed that government intervention to support demand would provide a more substantial economic recovery as savers would be converted into consumers and economic activity would inherently increase.
These theories have become entrenched in global economics and have been put to the test recently with the 2001 and 2009 market meltdowns. Yet, we believe something unprecedented has taken place recently and most of the industry analysis still fail to understand the affects and results of these clear indicators. First, Central Banks have backed this recovery with over $18T (globally) over the past 7+ years – a massive amount of capital investment. Second, M2 Money Velocity has decreased dramatically over the past 7+ years (to levels not seen in 50 years).
Interestingly, M2 attempted a slight recovery between 2003~2005 at levels much higher than statistically normal levels over the prior 40+ years. This move is very telling in the sense that capital supply post 9/11 was resulting in healthy M2 velocity acceleration – a sign of a healthy and organically growing economy. As M2 Velocity begins to increase, the economic engine is revving up on its own. After the 2009 market crisis, though, M2 Velocity has fallen dramatically and this tell-tale indicator is indicating that we have yet to see the economy begin to REV-UP. When it does, it could be a dramatic and explosive move.


In our opinion, the recent warnings from industry analysis of a potential “end to this run” or “end of the Trump Bump” are failing to understand the fundamental capital process that is taking place right now. In simple terms, the global Central Banks have injected nearly $18+T of capital into the markets that is searching for healthy returns. Much of this capital has been used to pay down corporate debt and to provide a recovery in the ailing housing markets. Additionally, much of this capital has been deployed into restoring financial order and capabilities within foreign governments and banking institutions. Therefore, we can assume that a portion of this capital has already been deployed into suitable fundamental support systems. Yet, a large portion of that capital is still searching for capital opportunity and will transition as the marketplace identifies healthy opportunities.
It is our opinion that we are about to enter a phase of a super-bull run that may last for an unknown period of time in certain markets. We believe the US, Canadian and UK markets are uniquely positioned to take advantage of this opportunity because they inherently support mature and structurally functional economic systems. We believe other, shorter-term, opportunities will present themselves in other foreign markets as dynamics shift that represent uniquely healthy economic investment. Just as quickly as these dynamics shift from one opportunity to another, the capital deployed into these opportunities will shift equally as fast.
We do expect market pullbacks and minor corrections to occur throughout this phase of the super-bull run. It would be foolish to think that this transitional shift in capital deployment would not be without some risk. We believe any positive rotation in the M2 Money Velocity indicator will be a strong sign that “capitulation of capital process” is beginning to take hold and become the turbo-charger of the mature markets (US, CAN, UK). Until this happens, our analysis is structurally sound and functional, yet it is missing the component that will create the “super-bull event”.
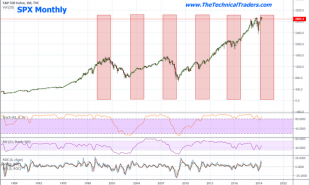
See for yourself how the market is reacting within these channels and try to understand that capital will always seek to find healthy economic environments that support adequate ROI. Given the amount and scope of capital that has recently been injected into the global markets, we believe the only locations this capital will find for adequate ROI will be the mature economic systems with the capabilities to innovate, lead and adapt to global market inconsistencies.

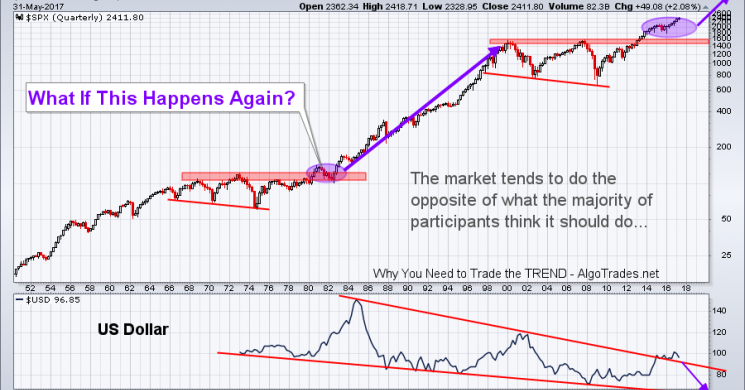
While I feel the equities market will run out of steam later this summer July/August, there is a case for the super bull-run, the ultimate wall or worry fueled by renewed M2 volocity and a recovery at some point. Take a look at the chart below because a bull market like this could be happing again and catch everyone off guard:

Do you want to learn how to profit from our detailed analysis of the markets? Visit ATP and learn how we can help you understand market dynamics, opportunities and develop clear objectives for success.
Our specialized Momentum Reversal Method trading system identifies trade setups that often result in 8~35% winners.
Recent Trades: ERY 4.75%, in 2 Days
SLV 3.2%, in 6 Days
MOBL 15%, in 7 Days
FOLD 9.5% in 40 Days
See for yourself how we can assist you in developing success: www.ActiveTradingPartners.com
Read more by TheTechTrader


