Author: Enda Glynn, Bullwaves.org
EURUSD
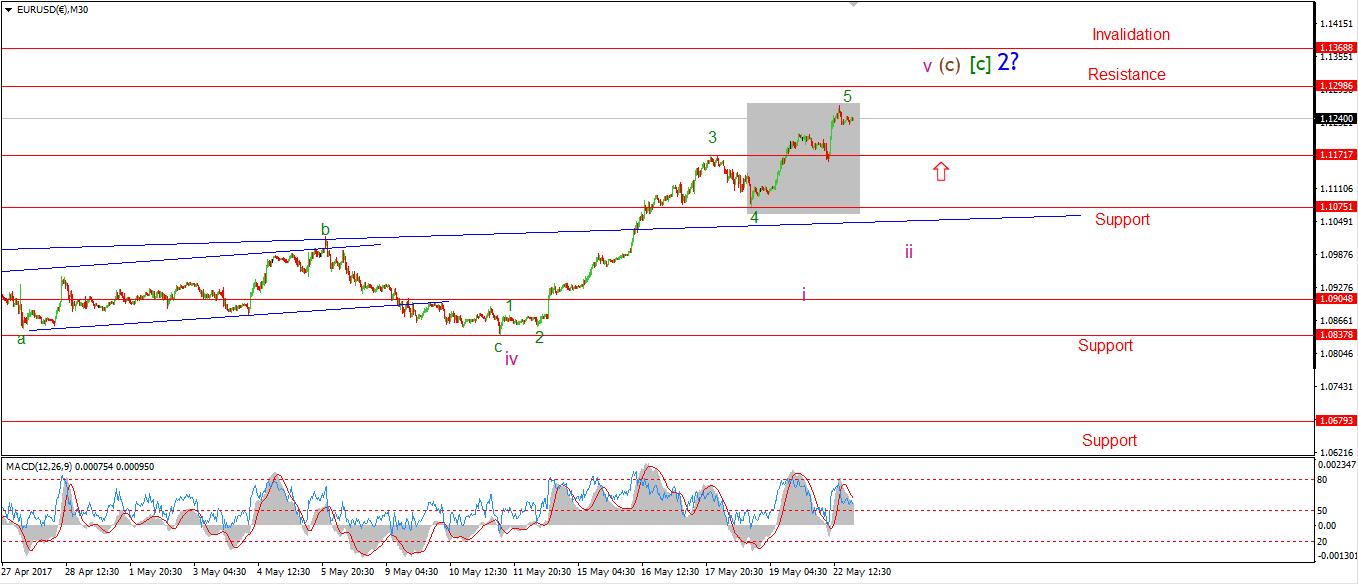
30 min
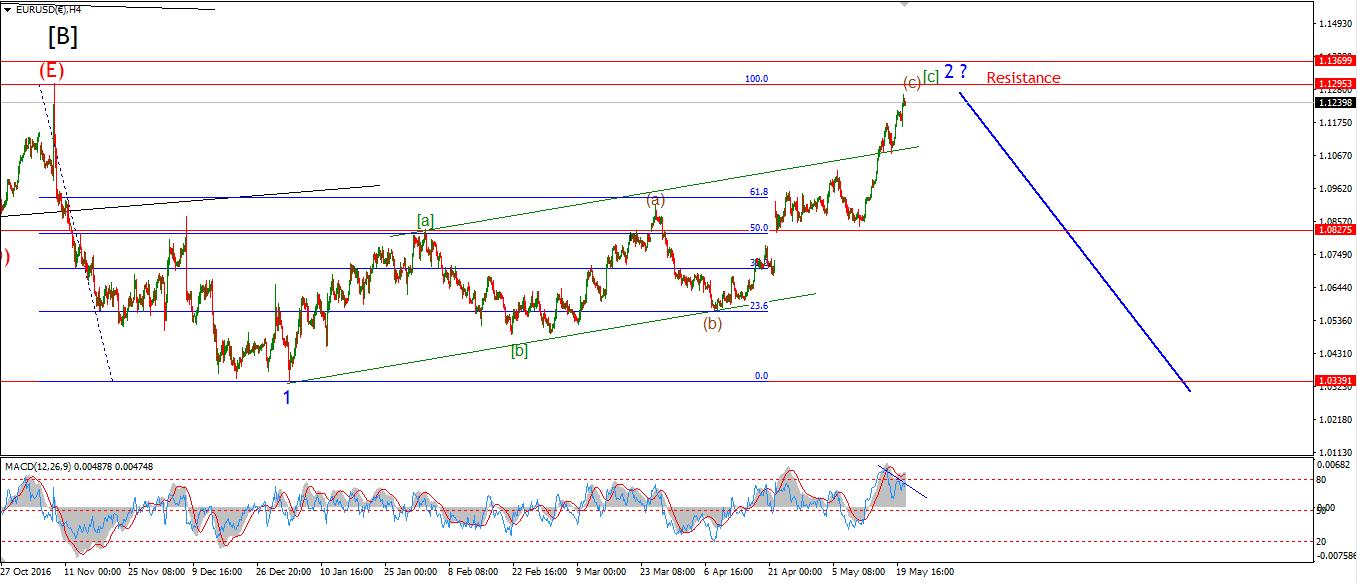
4 Hours
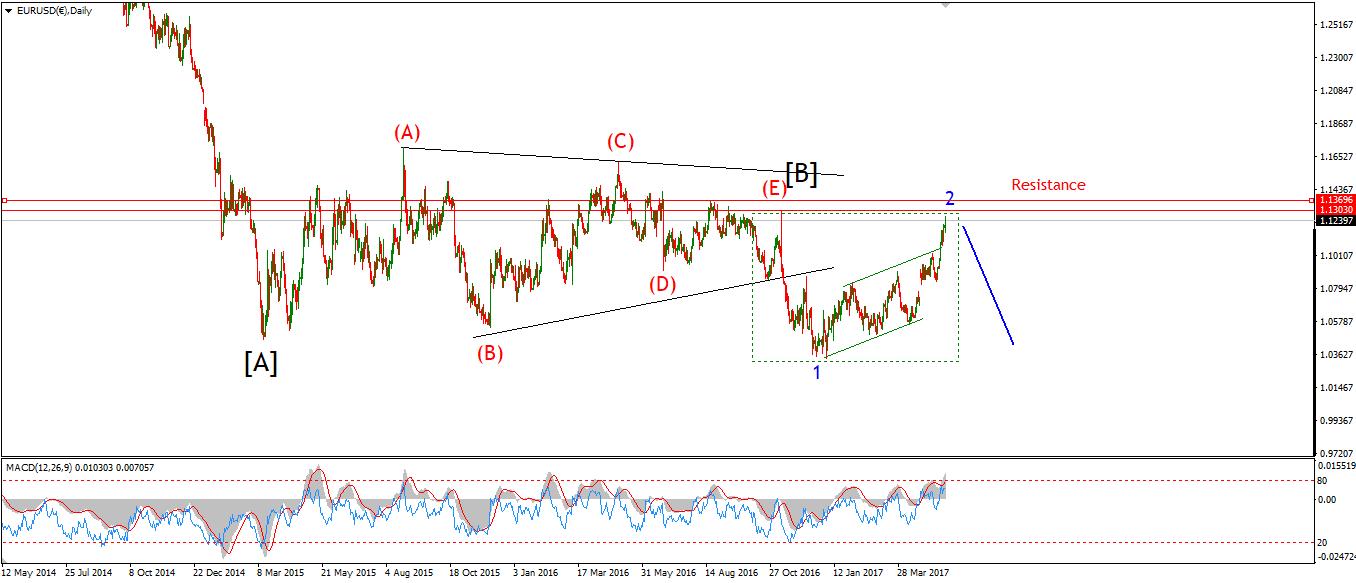
Daily
My Bias: short in wave 3 blue. Wave Structure: downward impulse wave 1, 2 blue Long term wave count: lower in wave 3 blue Important risk events: EUR: German Ifo Business Climate, Flash Manufacturing PM, Flash Services PMI. USD: New Home Sales, FOMC Members Speak.
Good evening everyone. I hope you all had an enjoyable weekend.
Let me start with some momentum stats on EURUSD to illustrate how overbought this pair is at the moment. Daily MACD is at a 13 month high today. Daily RSI hit a 2 year high today! Not seen since August 2015 at the wave (A) high shown on the daily chart.
The messege is simple here; Get out while you still can!
The price did punch higher again today, and again came close to invalidation of the current wave '2' blue interpretation. I have highlighted the recent up move of the last few days in wave '5' green. The pattern is a clear five wave movement off the wave '4' low at 1.1075.
The pattern is incredibly over-extended at the moment. The foundations of this rally keep crumbling according to the wave count and the generally technical setup. Also the 4hr RSI has again diverged from the price and is pointing to a turn near at hand. All that is missing is the price to decline. 1.1075 is the first significant support in the price structure. watch for signs of a turn tomorrow.
GBPUSD
30 min
4 Hours
Daily
My Bias: short below parity. Wave Structure: continuing impulsive structure to the downside in wave (5) Long term wave count: decline in wave (5) blue, below parity Important risk events: GBP: Public Sector Net Borrowing, Inflation Report Hearings. USD: New Home Sales, FOMC Members Speak.
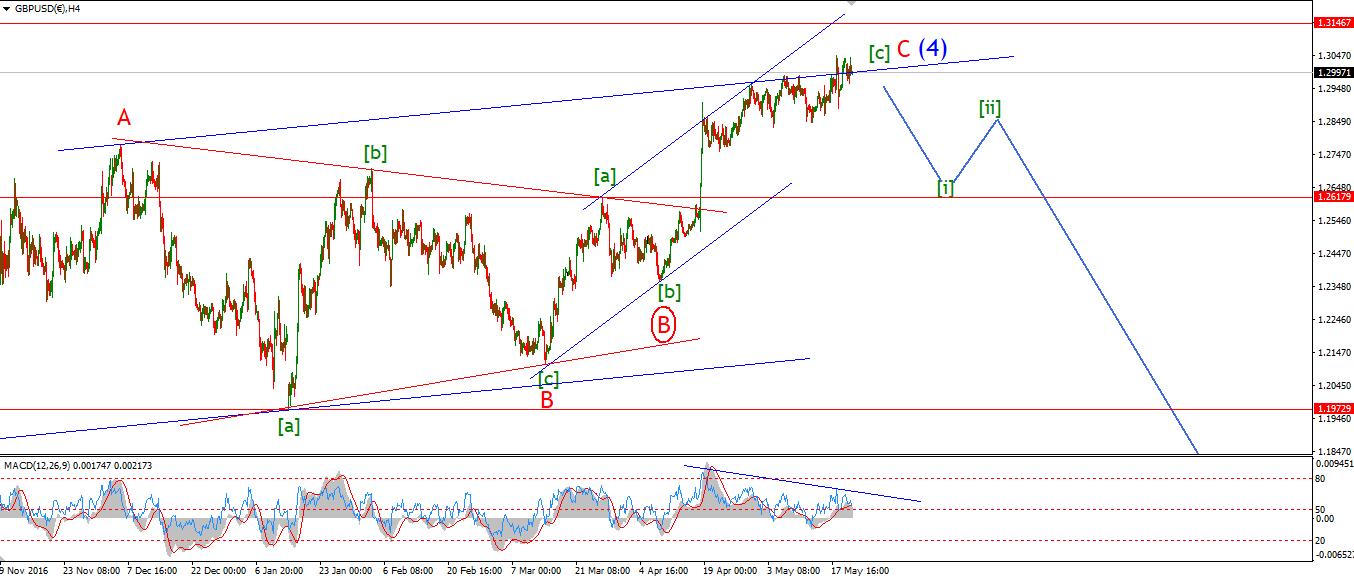
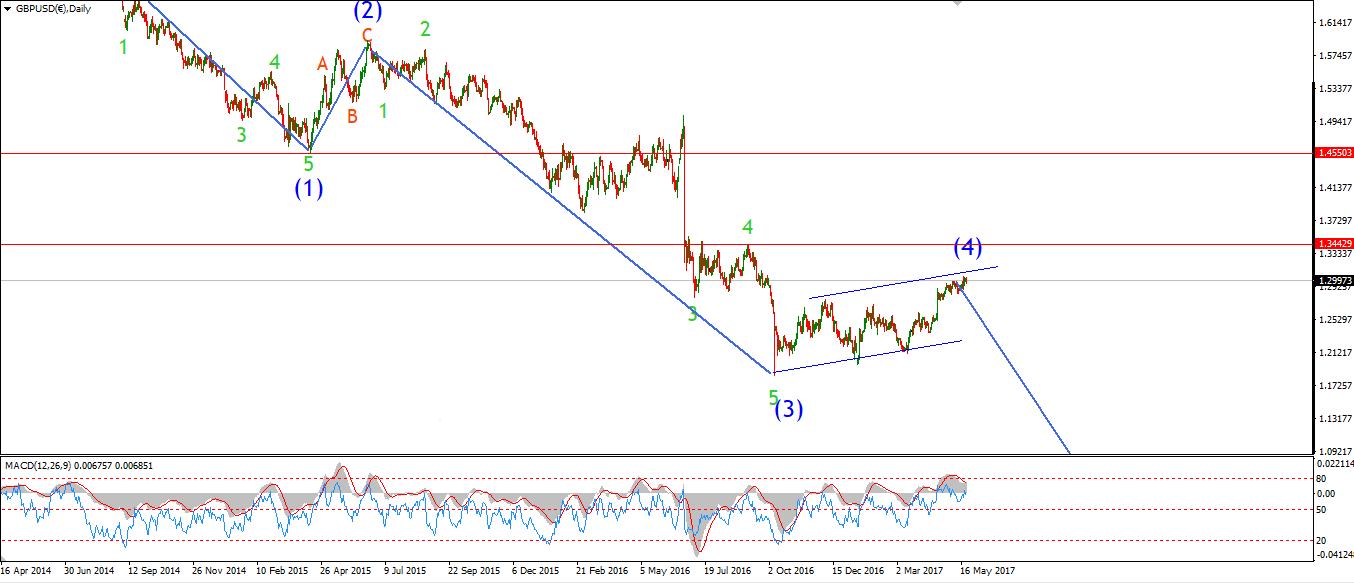
Cable sits in a similar position to EURUSD going by the big picture setup. Daily MACD has diverged to the downside from a 22 month extreme high. Daily RSI has also showing bearish divergence form the same 22 month extreme high reading on the 30th of april. The correction in wave (4) blue is the correct interpretation for the larger wave pattern. The price has ranged to the upside for almost 8 months now, without a whole lot to show for it. The wave pattern in the short term is closing out at five degrees of trend, hence the consecutive lurching higher in the price structure. And soon enough the short term pattern will conclude and turn down for good.
The picture here is looking grim to say the least. So as I have been urging over the last few weeks, it is time to prepare for the decline.
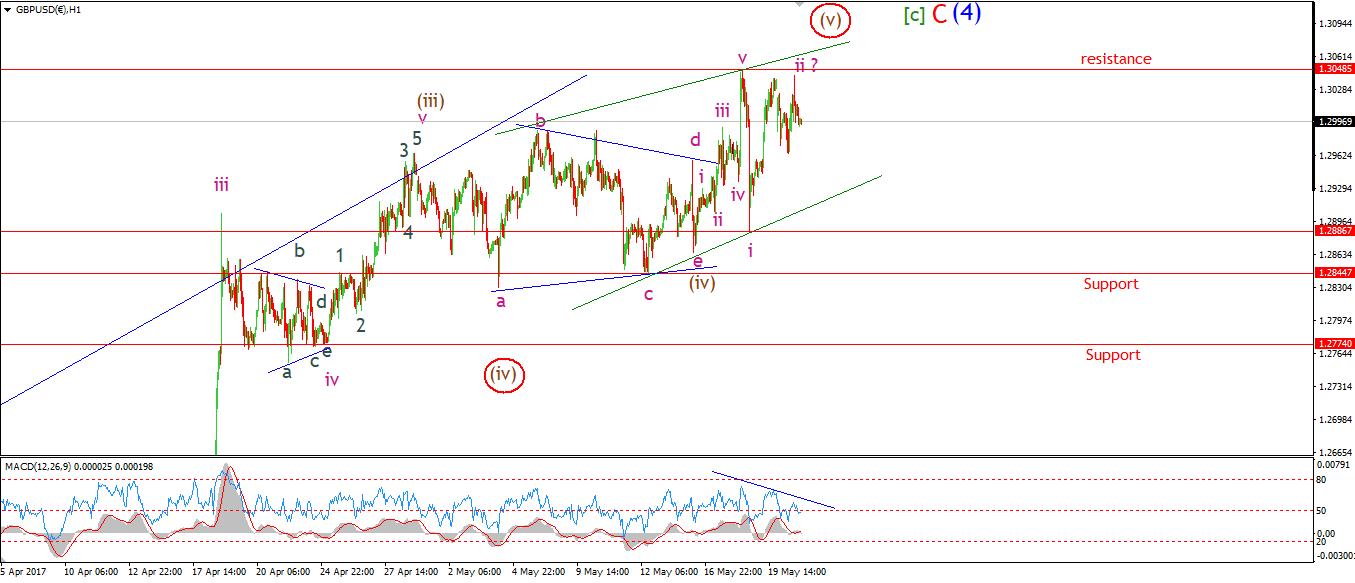
The hourly chart shows a possible alternate wave count in wave (v) brown. The green trend lines indicate an ending diagonal which projects a slight new high to complete the five wave pattern at about 1.3080 or so. It is evenly balanced between the two wave counts at the moment. either way a break of 1.2887 will push kick off the new downtrend.
USDJPY
30 min
4 Hours
Daily
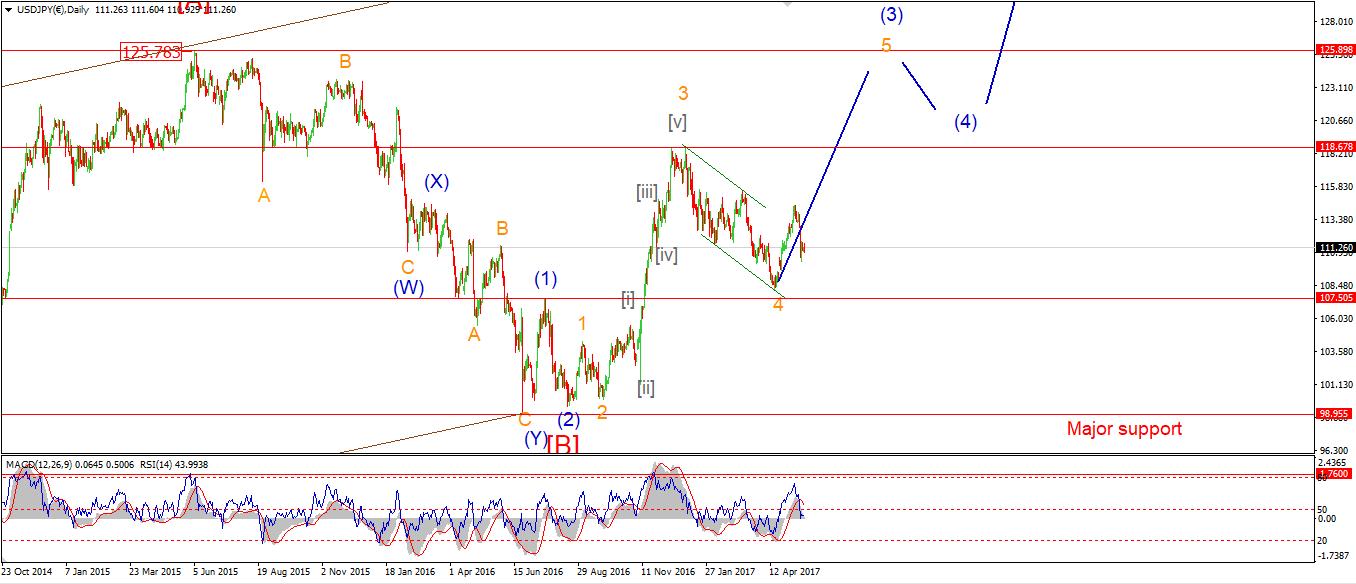
My Bias: LONG Wave Structure: rally in wave [C] Long term wave count: wave [C] is underway, upside to above 136.00 Important risk events: JPY: N/A. USD: New Home Sales, FOMC Members Speak.
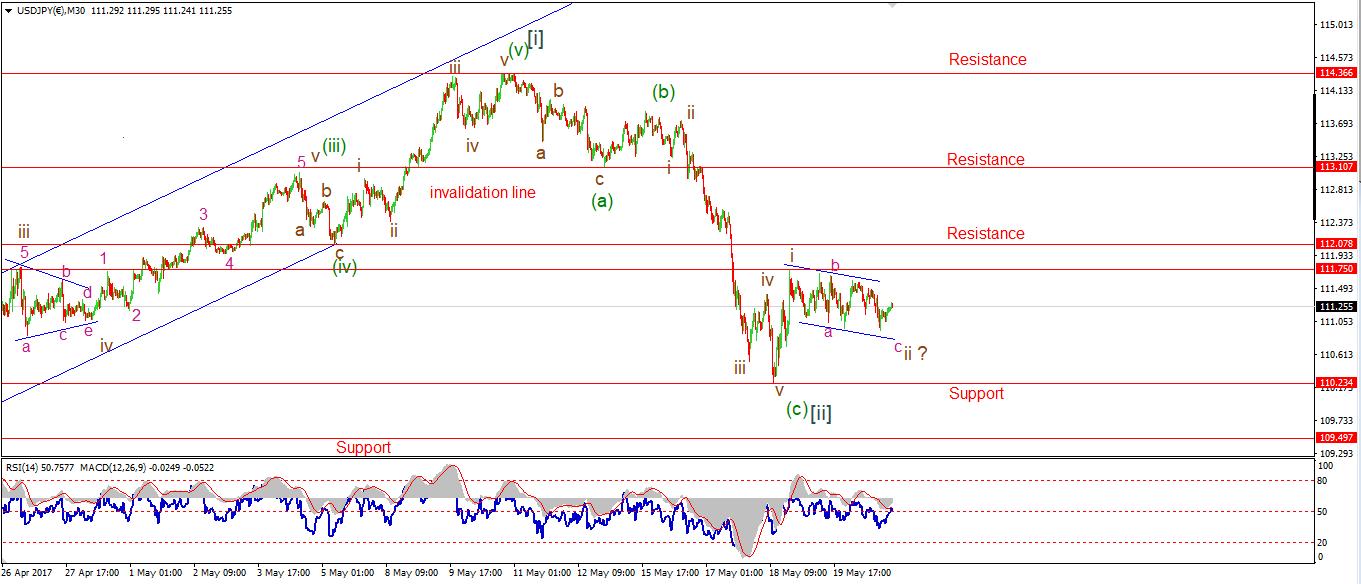
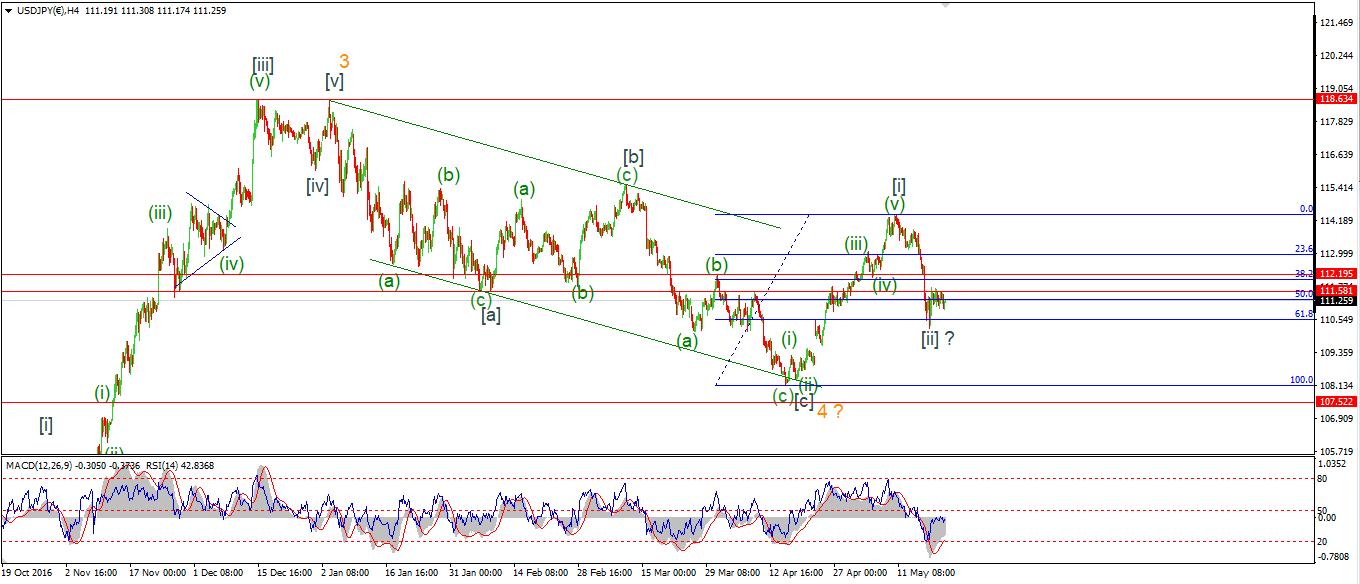
The sideways action continued today in USDJPY, adding to the idea that the price has put in an important low at 110.23. I have re-labelled the price action off the low at a lower degree of trend. Waves'i' and 'ii' brown, as opposed to Fridays chart.
Believe it or not; Last weeks lows registered a more sever oversold condition on the 4hr chart, than at the lows of April 17th, which was 300 point lower! This indicates to me that this rally is just heating up. The 4hr RSI has not registered a buy signal yet off last weeks lows. But a bullish centreline cross is on the cards this week.
As for the short term count; A bullish Elliott wave signal is present at the moment. 110.23 is the critical low, a break of 111.75 will likely confirm wave 'iii' brown to the upside.
DOW JONES INDUSTRIALS
30 min
4 Hours
Daily
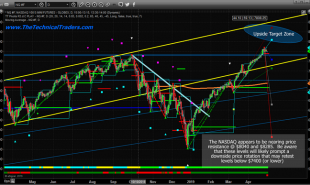
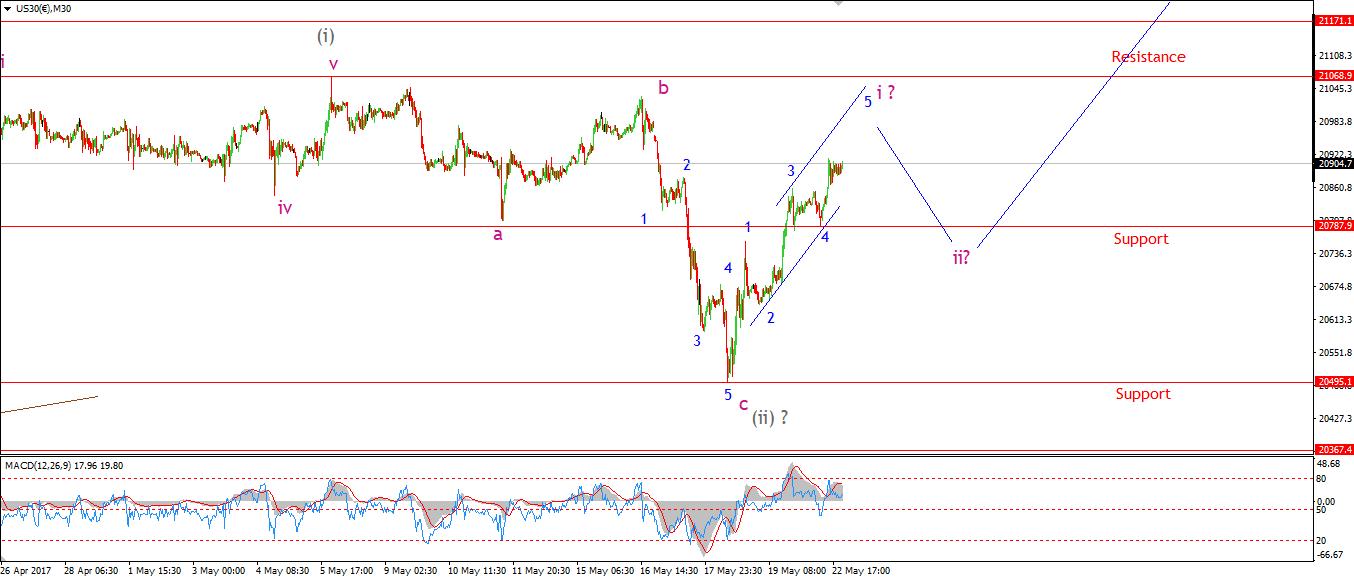
My Bias: market topping process ongoing Wave Structure: Impulsive 5 wave structure, possibly topping in an all time high. Long term wave count: Topping in wave (5) Important risk events: USD: New Home Sales, FOMC Members Speak.
The DOW is now nearing completion of a five wave pattern off the lows of last week. I have again re-labelled the action at one lower degree than Fridays chart since this fits the action better.
Wave 'i' brown is projected to reach the 21000 level again and a short correction in wave 'ii' brown should kick in at that point. And wave 'ii' brown will likely find support at 20787, the previous 4th wave low of one lesser degree.
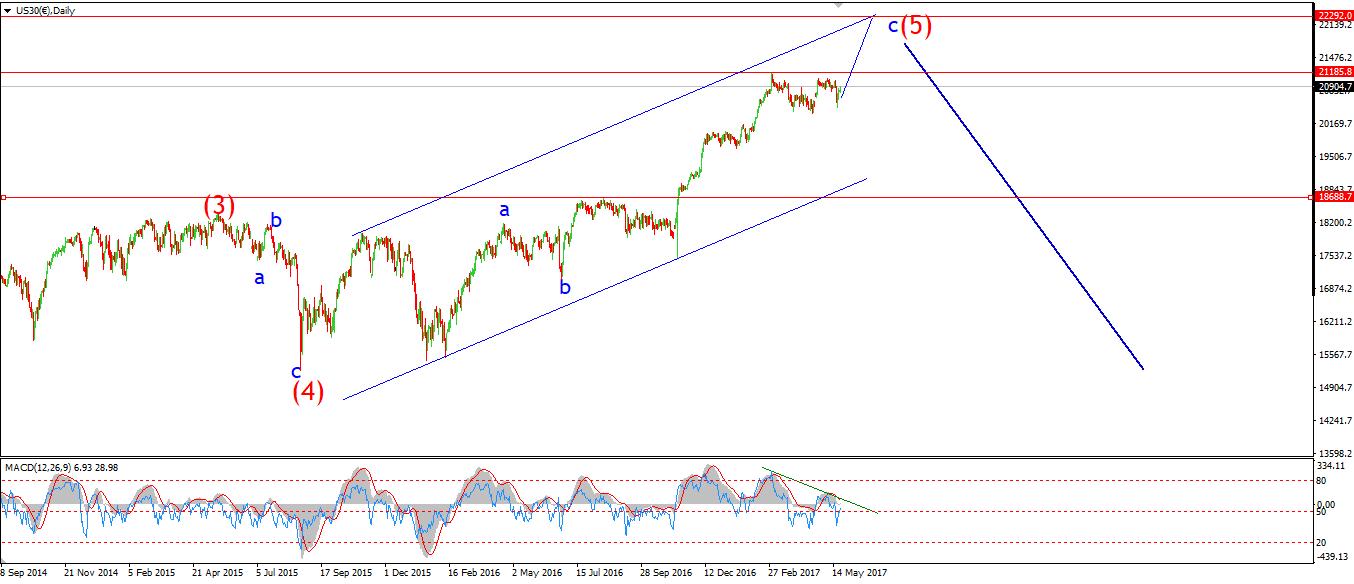
At that point the price should rally strongly as part of the final leg higher in this never ending bull market! The astute investor will take note of the momentum setup on the daily chart. The RSI has diverged significantly to the downside from the price. This is the first a shot across the bow in the long term pattern. The daily chart shows an upper target at 22300 or so for this final rally to conclude. Where the price will touch the upper trend line one last time.
GOLD
30 min
4 Hours
Daily
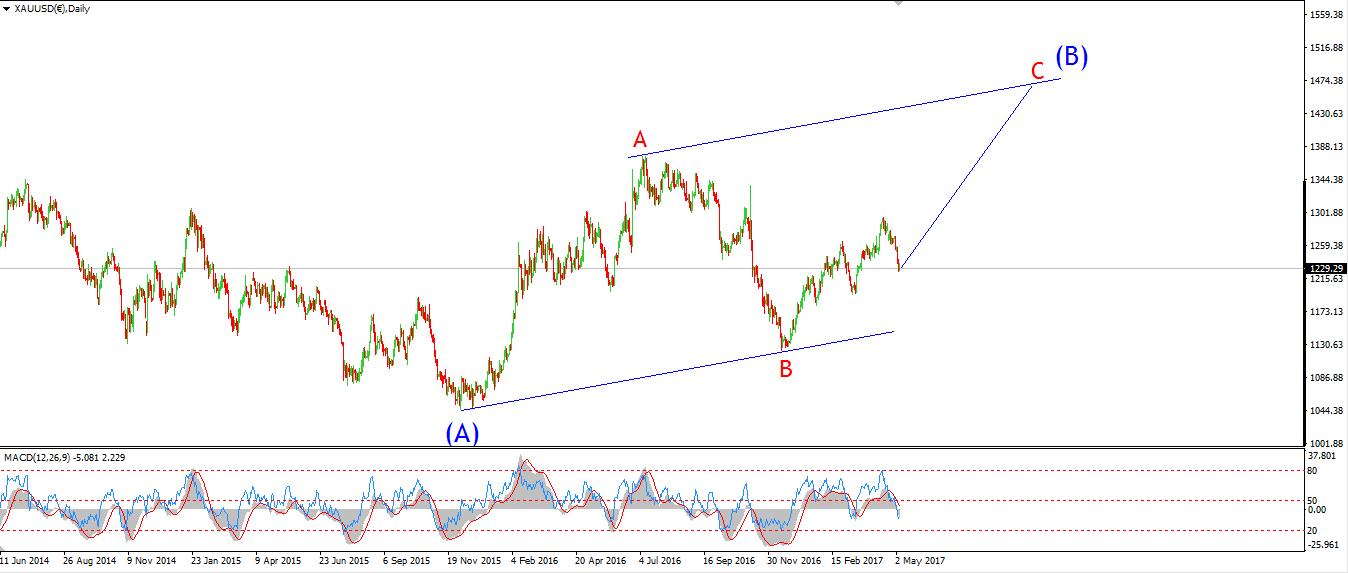
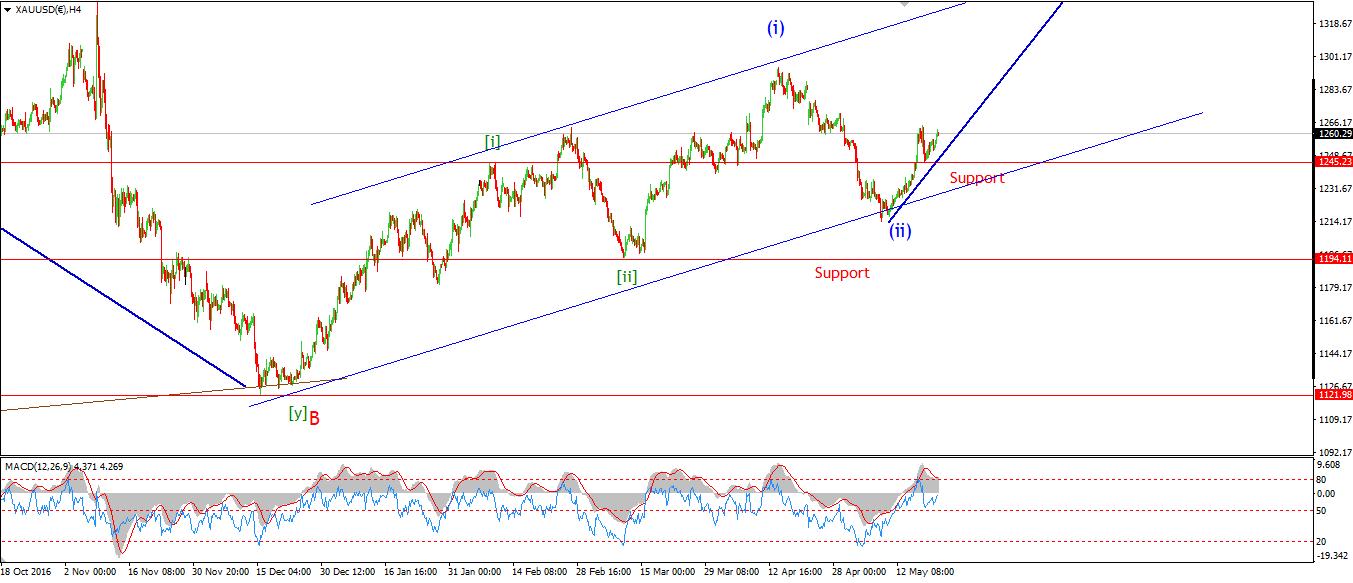
My Bias: Long towards 1550 Wave Structure: ZigZag correction to the upside. Long term wave count: Topping in wave (B) at 1550 Important risk events: USD: New Home Sales, FOMC Members Speak.
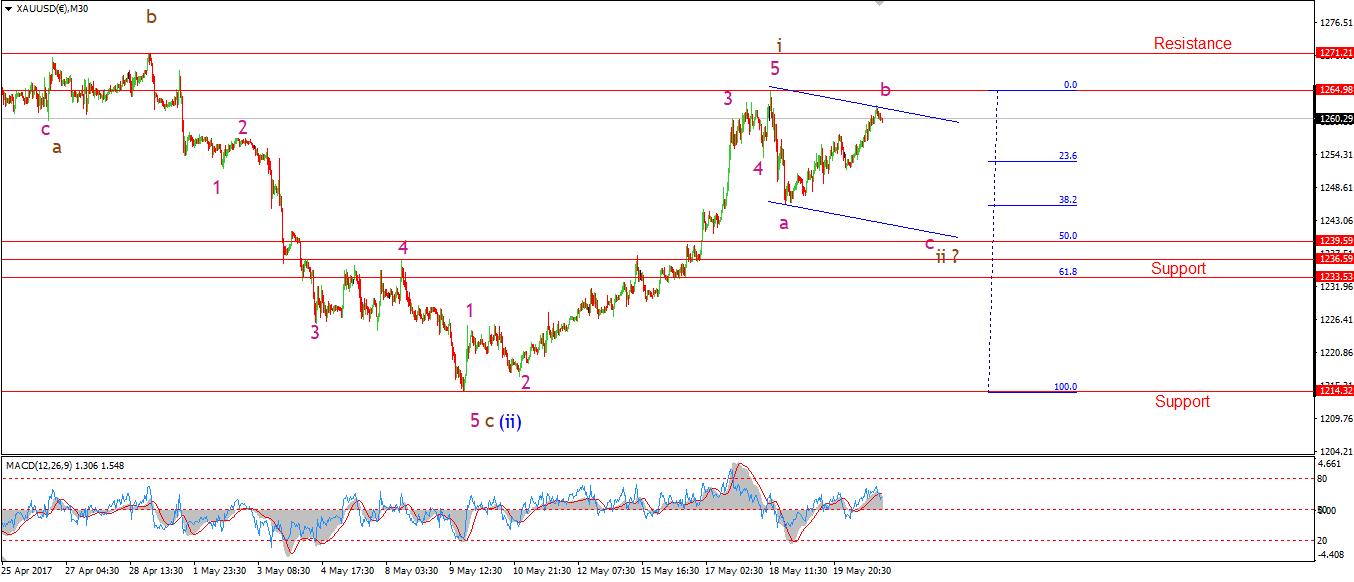
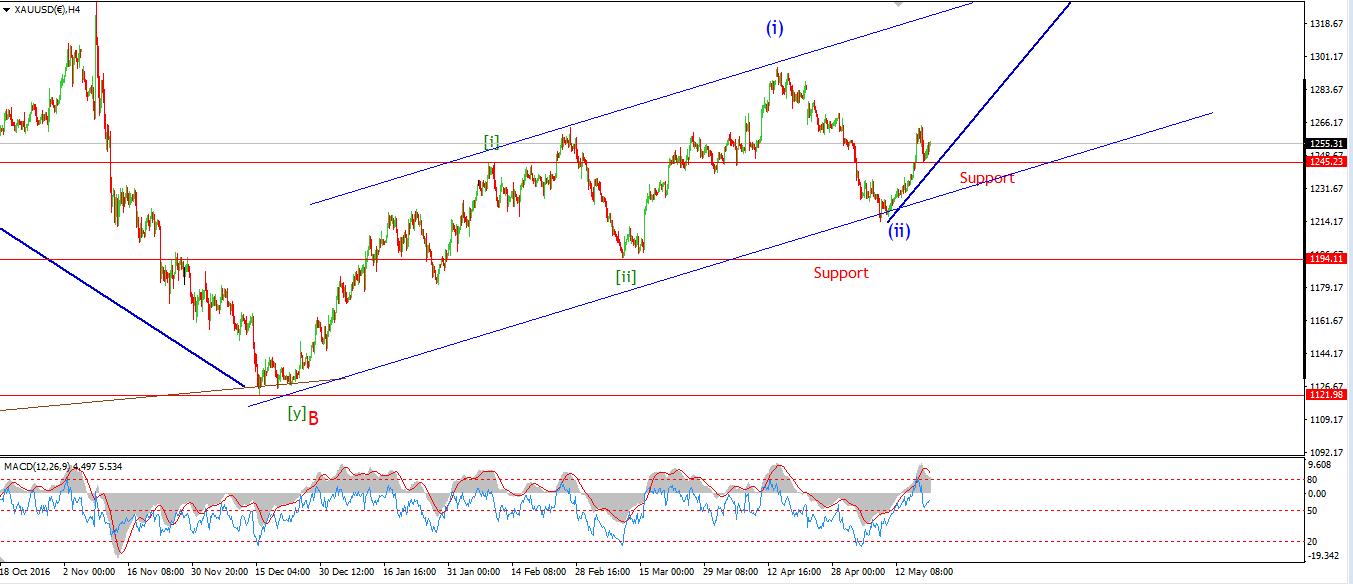
GOLD seems to be correcting within wave 'ii' brown. The pattern looks likely to continue for another few days, with wave 'c' pink yet to come. The 50% retracement lies at 1239.59 and this is the first likely target for wave 'ii' to complete.
Once wave 'ii' shows three complete waves, the price will be primed for the next rally phase. And going by the current wave count, it could be a big one!
Watch for a turn lower tomorrow, and the completion of five waves down in 'c' pink.
Author: Enda Glynn, Bullwaves.org
Read more by Enda Glynn