Gold's Wasteland to Be Tested
Between $1190 and $1340 in Gold is for us the area of noise. This is the area where traders play their games. We play in the noise-laden area frequently. Outside that range and you get real interest and attract new attention. This is based on applying a very good short term volatility indicator we use to a much longer time line. But right now it is looking like we will be violating one of those levels inside the next 3 months. First, the Noise boundaries.
$1190
If you are a buyer looking to accumulate, start putting on your buy shoes to average in below $1190. If you are a momentum player who sees weakness in that area, short the market looking for a quick dump of $50 to $200. This is the area where physical demand will come head to head with momentum and panic selling. Bank on it
$1340
If you are long and wish to take profits, start scaling out above $1340. The market could have a nice spike above that area to lean into. Conversely, if you are a momentum player looking for a good timing entry for a possible $50- $200 move, that's your entry point.For momentum types timing an entry the stop loss is approximately $50 away from your entry if you wish to use one.
Trading Gold is Not Easy Unless You Have Producer Client Flow
Those of us who trade for a living must pay attention to every wiggle and waggle. We cling to $10 moves as if our lives depend on it. And sometimes they do. For capturing a $20 move in Gold once a month is money in your pocket. Subsequently, volatility of a market is the lifeblood for traders like ourselves. This is why Gold is so particularly hard to trade short term. Its volatility is low, but its "surprise" factor is high. By analogy: On average the ranges are $10.00. But that is 49 days of $5 ranges and 1 day of $75 movement to put it in perspective.
The mean (average range) is useless in a market that is susceptible to liquidity gaps. That is why there are less momentum types who play the market for a week of trading than in the past. Now, most momentum is algo based an in/out for a tick in 5 seconds.
-
Industry Sellers
Gold and Silver are thus dominated by commercial sellers comprised of producers and those Bullion Banks who handle their orderflow. They have a virtual monopoly just by their concentration of power. They do not compete with each other. They, for the most part, share the same client book, and those producers all have roughly the same price levels they must sell to make money.
-
Industry Buyers
Meanwhile on the bull side of the equation you have jewelers and fabricators for end-users like coin makers. This buy-side industry is fragmented and competes with itself. Not to mention the buy side does not have access to the Fed window for almost free money to cover any margin call if ever one was given.
-
Hedge Funds
That leaves the speculator to fill the gap. And the more profitable ones with time frames under 1 month are short players. The buy side specs with longer time frames like Druckenmiller are the ones who capture profits being long usually.
Algorithms that seek the weakness in the market will almost always find it in stop orders to the downside, as they should. The market structure of Gold and Silver is such that Producers and Commercial dealers have much deeper pockets and can sustain paper losses greater than the buy side types.
Speculators on the long side like hedge funds (even Druckenmiller types) who buy some metal as a hedge against uncertainty, are non-plussed when they have to sell. Gold is such a small part of their portfolio they could care less when they exit. As a percentage of risk, Gold is a punt for their portfolio. These funds also are competing against each other for investor money. And what investor that has the patience to hold an asset for 2-5 years would even be giving their money to a hedge fund to buy gold? None.
-
Central Bank Buyers
The class of investor that holds that "Patience" title are Central Banks who continue to buy despite the verbal derision spewed at Gold. Eastern Central Banks like Russia and China top that list. But they are as patient as the sellers above. They never chase the market and just place their bids below. This is the root physical demand that is keeping the market afloat.
Wasteland of Noise
So between the sellers above who almost never have to worry about cash flow, and the buyers for central banks who never have to chase because they control the monetary situation and can bend it to their will as needed what is left? Noise.
The noise of small momentum players like us who look to capture the first $10 of a $50 move. The noise of algorithms that seek to capture ticks per hour on stop hunts. And the noise of larger hedge funds crowing to buy Gold after they have bought it for themselves. These players make the most money inside the commercial sellers and Central Bank buyers. They capture the $50 moves and create exits for themselves. This is all fair.
For us it is important to know where we are in the pecking order of the Noise area. Then after knowing our "place"; What if we were to look to play outside the noise area? First we'd have to define it.
The Noise area is the trading range in which the market attracts few new or fresh participants. On either side of that area, you will see new money, or old money playing their macro plays alongside Commercials selling or Central Banks buying.
VBAS Momentum Applied Outside the Noise
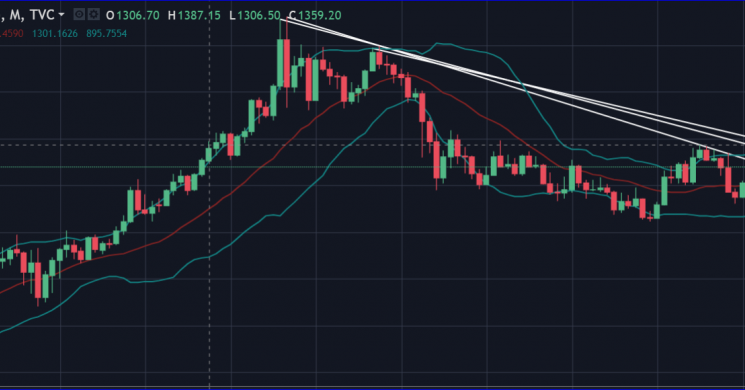
So if we take off our trading glasses and put on our "wealth preservation" spectacles the reality of Gold's value is obvious. The problem is that for 5-10 year positions (beyond the usual 5% holdings as a USD hedge) , how does one time their purchases? We think we may have narrowed down the next big entry points in Gold by ironically applying a short term algorithm used to determine Gold's volatility acceleration over a much longer time frame. Simply put, we took our hourly and daily indicator and overlayed it on a monthly chart for fun.
The Volatility Based Algo System (VBAS) we use gives an indication of increased likelihood of violent quick moves when certain conditions are met. It is by nature directionally agnostic. But we have used it, and shared it here as a directional tool based on a simple premise. The premise is: The VBAS, when triggered will give you an alert that the market will move pretty quickly in one or the other direction. Therefore, using other indicators, pick your direction. The Algo will not only give you a good risk / reward set up, it will tell you if you are right or wrong rather quickly. it is designed to give you quick feedback and deter rationalizing bad positions.
In the chart above where we've gotten signals using the VBAS on the monthly chart you will see ovals drawn. Where the signal followed our directional indicator we drew yellow lines. Where the signal quickly rejected our directional indicator we drew a red arrow. in all instances, you know if you are right or wrong inside of 2 bars.
The most obvious "tell" you can see is the Bollinger bands get very tight before a major move. There are other filters we use to determine if the risk reward is valid to play. And upon getting a proper risk reward set up, another filter is used for direction. That filter is usually in the direction of the band-line being broken. Suffice to say that if either side of the Bollinger bands is broken (we use 1.5 STD) we will be making a decision to go with the flow, or fade the trade.
Now we are seeing another alert creep up on the monthly. Normally we'd use this for bias, and then look for an hourly or daily trigger to play. If we get lucky we'd bag $20 of a $100 move. But what if we played longer?
This is used successfully for day and week trades derived from the 60 minute, 240 minute, and daily charts. Our own tolerance is 3 bars and we are out. But if you are a true investor who is interested in where the bigger players will get involved, those levels are currently above $1340 and below $1190 basis spot.
One overly simplified example would be: Buy Gold on a closing bar above $1340 in which the Bollinger band outer lines widen in OPPOSITE directions. This indicates volatility expansion and hopefully directional momentum. The trick from there is knowing when to get out. Initial stoploss on a trade of this type would be where the BBand midline comes in. The price target should be at least 150% of what the stop loss risks. Then be aware that we would then be outside the "noise"area. This will attract powerful momentum buyers, and commercial based macro sellers after a bit. The inverse is true on a slide below $1190.
Good luck
Read more by Soren K.Group


