Florence, now a tropical depression, made landfall in North Carolina on Friday, bringing with it destruction and calamity, the cost of which could top $170 billion, according to analytics firm CoreLogic. If so, that would make it the costliest storm ever to hit the U.S. To date, 2005’s Hurricane Katrina holds the top spot, costing an estimated $160 billion, followed by last year’s Harvey ($125 billion) and Maria ($90 billion).
Not to minimize the impact Florence will have on millions of Americans’ lives, but storms, even of this size, have rarely triggered major equity selloffs. According to research firm CFRA, in the last 15 years, the S&P 500 Index declined an average 0.2 percent in the month after a hurricane, but was up an average 3.9 percent in the subsequent three months. Home improvement companies such as Home Depot and Lowe’s could be beneficiaries, while insurance companies might take a hit.
Markets are subdued right now, with the S&P 500 having gone more than 55 days without a 1 percent move in either direction. Trading volumes are also lower-than-average, suggesting Wall Street is in wait-and-see mode before making major adjustments.
Could this just be the calm before the storm?
Consumers and Small Business Owners Are Feeling Good
Appropriately enough, Florence comes to us on the 10-year anniversary of Lehman Brothers’ collapse— the spark that set off the financial crisis—reminding us it’s never the wrong time to prepare for such a catastrophe. (I’ll have more to say on Lehman later.) That includes now, even as a raft of positive economic data was released last week. 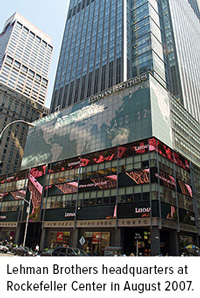 The University of Michigan consumer sentiment index climbed to 100.8 in September, against expectations of only 96.6. This was its second-highest reading since 2004.
What’s more, the NFIB Small Business Optimism Index soared to 108.8 in August, its highest level ever in the series’ 45-year history.
“As the tax and regulatory landscape changed, so did small business expectations and plans,” commented National Federation of Independent Business (NFIB) president and CEO Juanita Duggan.
Against this background, Nobel laureate Robert Shiller told Bloomberg last Thursday that the market “could get a lot higher before it comes down… It’s highly priced, but it could get much more highly priced. It’s a risky market now.”
Time to Get Defensive?
Ray Dalio has a slightly different perspective. The billionaire founder of Bridgewater Associates, the world’s largest hedge fund, reminded investors last week that we’re in the “seventh inning” right now, and as such, investors should probably get “more defensive.” Recently I shared with you that the global purchasing manager’s index (PMI) is steadily slowing down, falling to a 21-month low of 52.5 in August.
Again, markets have been relatively tranquil for a while now, but just as people on the East Coast were urged to prepare in anticipation of Florence, now might be the time to adjust your portfolio in advance of a possible market downturn. Last week, Goldman Sachs reported that its bull/bear indicator, which gauges the likelihood of a bear market, climbed to its highest point since 1969.
 Goldman analysts point out, however, that the indicator could be read to mean not that a bear market is right around the corner, but that a period of lower returns could be expected.
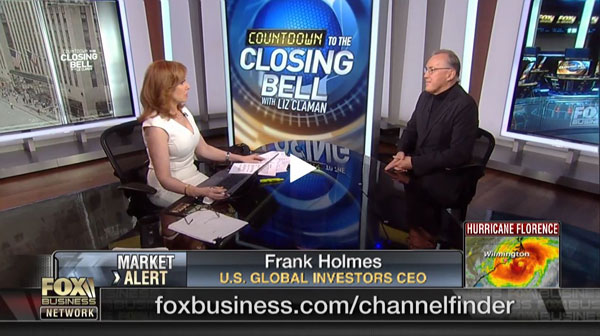
One of the ways investors could batten down the hatches, so to speak, is with gold, which historically has performed very well in September as we approach Diwali and the Indian wedding season. Last week I had the privilege to join Liz Claman on FOX Business’ Countdown to the Closing Bell, and I told her that, under the circumstances, gold is doing exceptionally well. The precious metal may be under pressure from a strong U.S. dollar and higher Treasury yields, but in Japan, Germany and elsewhere, government bond yields are negative, which has boosted gold demand.
While I’m here, I’d like to congratulate Liz and her show—Countdown placed in the top four business news programs this past quarter, reaching nearly 230,000 viewers, according to Nielsen Media Research. Liz continues her reign as the highest-rated female business news anchor on television. I’m very honored to be able to share my views with her and her audience, and to have appeared in her 2007 book, The Best Investment Advice I Ever Received.
What Caused the Lehman Brothers Bankruptcy: A New Accounting Rule
Before my interview, Liz spoke with the very man who was called in to conduct forensic accounting on Lehman Brothers’ bankruptcy, Anton Valukas. The fourth-largest U.S. bank at the time of its demise, with $85 billion worth of mortgage-backed securities, Lehman resulted in global market-cap erosion of $10 trillion in October 2008 alone.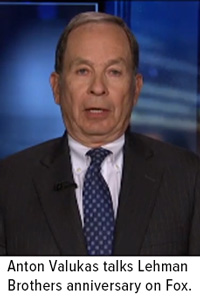
Among the most eye-opening comments Valukas made during his interview is that “the federal government knew everything Lehman was doing—its risk exceedances [and] the fact that they did not have a liquidity pool.” According to Lehman’s 10-K from November 2007, the bank was leveraged an incredible 30.7 times its net worth, up dramatically from 23.7 times only four years earlier.
“Why were there no prosecutions or civil suits?” Valukas asked. Simply put: “The government knew.”
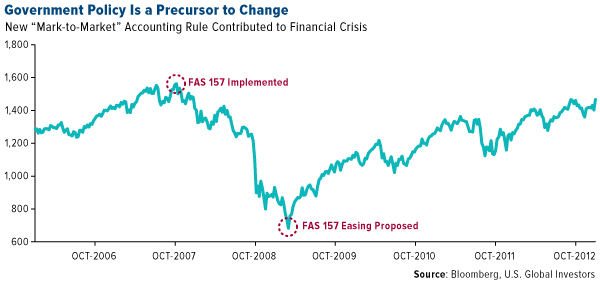
Some of the blame is also owed to an accounting rule, FAS 157—also known as “mark-to-market,” or “fair value accounting”—that was enacted in November 2007. A year later, after Lehman had sent global markets in a tailspin, FAS 157 was already being fingered by some as the culprit. William Isaac, the former chairman of the Federal Deposit Insurance Corporation (FDIC), said before the Securities and Exchange Commission (SEC) that the bankruptcy was “due to the accounting system, and I can’t come up with any other explanation.” Steve Forbes, chairman of Forbes Media, called mark-to-market accounting the “primary reason” for the meltdown.
I’m in agreement, writing back in March 2009 that “a case could be made that the convergence of FAS 157, highly leveraged balance sheets and the loss of the uptick rule were the trigger that set off the financial meltdown.”
The Financial Accounting Standards Board (FASB) proposed more lenient accounting guidelines in March 2009—the same month the market bottomed and began to recover. Coincidence?
 So not only did the government allegedly allow the meltdown to happen, it then used taxpayer money to bail out the banks, which I believe exacerbated economic anxiety and sewed further distrust in the beltway party.
In my view, this contributed to two things: bitcoin, and the election of Donald Trump. Many people’s faith in traditional banking was obliterated, opening up the opportunity for a new type of currency, a cryptocurrency, to fill.
As for Trump, I wrote last year that the “bully,” as some call him, was elected to take on even larger bullies in the beltway party—career bureaucrats, regulators and other entrenched officials who make it their mission to oppose any Washington outsider who threatens to shake up the status quo. They were hostile to President Jimmy Carter, a fellow outsider, and today they're just as hostile, if not more so, to Trump.
The Short End Is Your Friend
On a final note, with interest rates on the rise, it’s important to stay on the short end of the yield curve when investing in fixed-income, as shorter-maturity yields are less sensitive to rate increases than longer-term bonds. This is one of five reasons why I think it makes sense to invest in municipal bonds right now.
To learn the other four reasons why munis might make sense, click here!
-------------------------------------------------------------------------
All opinions expressed and data provided are subject to change without notice. Some of these opinions may not be appropriate to every investor. By clicking the link(s) above, you will be directed to a third-party website(s). U.S. Global Investors does not endorse all information supplied by this/these website(s) and is not responsible for its/their content.
The Goldman Sachs bull/bear indicator takes into account five factors: growth momentum (measured by the average percentile for U.S. ISM indexes), the slop of the yield curve, core inflation, unemployment and stock valuations as measured by the Shiller price-earnings multiple.
The Michigan Consumer Sentiment Index (MCSI) is a monthly survey of U.S. consumer confidence levels conducted by the University of Michigan. It is based on telephone surveys that gather information on consumer expectations regarding the overall economy.
The NFIC Small Business Optimism Index is compiled from a survey that is conducted each month by the National Federation of Independent Business (NFIB) of its members.
The Purchasing Manager’s Index is an indicator of the economic health of the manufacturing sector. The PMI index is based on five major indicators: new orders, inventory levels, production, supplier deliveries and the employment environment.
The S&P 500 Stock Index is a widely recognized capitalization-weighted index of 500 common stock prices in U.S. companies.
Holdings may change daily. Holdings are reported as of the most recent quarter-end. The following securities mentioned in the article were held by one or more accounts managed by U.S. Global Investors as of 06/30/2018: The Homes Depot Inc.
U.S. Global Investors, Inc. is an investment adviser registered with the Securities and Exchange Commission ("SEC"). This does not mean that we are sponsored, recommended, or approved by the SEC, or that our abilities or qualifications in any respect have been passed upon by the SEC or any officer of the SEC.
This commentary should not be considered a solicitation or offering of any investment product.
Certain materials in this commentary may contain dated information. The information provided was current at the time of publication.
Read more by Frank Holmes


