Our weekend analysis of the markets continues to amaze our research team simply because we see so many other researchers continue to miss the signals. We've been calling this market bottom since the middle of February 2018 and we have stuck to our analysis even though we've taken some flack from others about it. Now, with earnings nearly upon us and the markets poised to either breakout higher or rotate lower, our longer-term analysis shows the markets are in pretty good shape for a continued upside rally.
This week, there are 214 companies reporting earnings data. Next week, there are 781 companies reporting earnings data. The following week, another 1003 companies release earnings data. Combined, we are going to have 1998 companies releasing Q2 earnings data and each of these, to some extent, could drive the markets higher or lower as this data is digested.
US Real Disposable Income has increased from $12,570 (December 2016) to $13,009 (May 2018) (source : https://fred.stlouisfed.org). Gross Private Domestic Investment has risen from $3,126.18 (Q4 2016) to $3,379.11 (Q1 2018) (source : https://fred.stlouisfed.org). Personal Income has risen from $16,027.03 (December 2016) to $17,005.4 (May 2018) (source : https://fred.stlouisfed.org).
Think about those core factors of the US economy as well as the facts that US companies have been able to rebuild and restructure – often running leaner and meaner than years ago. Of course, US corporate debt levels have risen in tandem with these personal income levels. US corporate debt levels have risen nearly 20% in 2017 alone. Yet, we continue to believe the overall health of the US economic is much stronger than many people believe, and we continue to believe a huge influx of foreign capital is driving the US equities markets to higher values in the face of any isolated economic concerns. The fact is that the US equity markets are really the only location on the planet where protection from currency devaluation and localized economic/equity deflation concerns can be thwarted (at the moment).
Onto the charts...
Monthly SP500 chart
This Monthly ES chart may be a little complicated to understand when you first look at it but pay attention to our analysis of this data and it will become easier to understand.
The two support channels (Yellow and Blue) are critical to understand price support. These longer-term price support levels are key to understanding how and when this current upswing in price may end (if it ends). Right now, these support levels are telling us that price has established a low rotation point and advanced higher setting up these support channels as key price levels should it break lower. As long as these support channels hold, price should continue to push higher.
Additionally, pay attention to out proprietary Tesla Vibrational Arc (circles) on this chart. They are showing us that price has recently exited the inner (25%) arc and is currently rallying outside of this price level. In theory, as long as the support channels hold and price attempts to move towards the next Tesla Arc, we can expect price to advance towards $2950 or $3080 throughout the end of this year. The current level, near $2800, can be seen as an “inflection point” where the outer RED arc crossed our Pitch Fan level. This would indicate that any move above $2800 would likely prompt a bigger upside move towards $2950 or higher.
Lastly, the Pitch Fans are drawn from 2016 low points and are used to attempt to identify and highlight price support and resistance levels. In this case, we are using them to identify “crossing points” where these fan levels cross our Tesla Arcs and other drawn lines to see where price may be targeting in the future. Just above the current price, we see a Red and Grey Pitch Fan level that is acting like resistance near $2850. Understand that these levels, once breached, will likely propel the ES price much higher.

Monthly Nasdaq chart
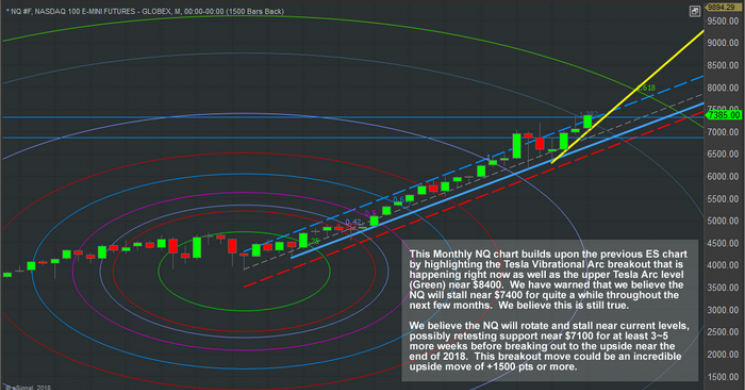
The Monthly NQ chart below shows similar price action to the ES chart – yet we see a more defined uptrend in place. As we've been warning, we believe the NQ will stall/rotate near the $7400 level for at least the next few weeks (3~5+ weeks) before attempting a further upside move into the end of 2018 and possibly longer. Right now, the NQ has rallied to all-time highs this month and is sitting very close to our $7400 target level. We can see from this chart we have two upward sloping price support channels (Yellow and Light Blue) that provide us with a very clear understanding of where price support is located. The current, Yellow, level is more recent and will likely be broken if the NQ stalls as we expect.
The Std. Deviation channel (the Dashed lines) on this chart shows that price has been rotating near the upper levels of this price channel and that price is attempting a breakout upside move currently. Notice the Tesla Vibrational Arc that is sitting very near to the $7375 level? This arc will likely result in some lower price rotation in the NQ over the next 3+ weeks with the potential that we could see a rotation to near $7100 or lower before another upside move sets up. Generally, when the price exits the upper Std Deviation channel and coincides with one of our Tesla Arcs, one of two things will likely happen; a. price will stall and rotate lower a bit before breaking out of this congestion or, b. price will blow right past this arc level in a massive price breach.
Right now, we believe our earlier estimate that price will consolidate and stall near $7400 is the correct interpretation.

Monthly TRAN (Transportation Index) chart
This Monthly TRAN (Transportation Index) chart below provides one of the clearest pictures yet of the true underlying market dynamics (in our opinion). Feb 2018 highs are still in place – they are still the critical component from a technical basis for any further upside price moves. Support channels, both the Green and Blue solid lines) are indicating that price is currently within these support channels and has not broken lower (yet). The Std. Deviation channels (the Dashed lines) are showing us that price is currently sitting near the lower Std. Dev levels (near dual support).
Additionally, the Tesla Vibrational Arc (the Purple arc near the current bars) is showing us that price has recently broken through the previous arc (the Light Blue arc near the Jan/Feb 2018 highs : 1.382%) and is struggling to break out of this new Purple Arc (1.50%). What this means to us is that price is “coiling near support and will likely make an explosive move – one way or the other”.
Now, take into consideration the Red Resistance Channel Line that created a Pennant/Flag formation recently. We've seen price, over the most recent 3+ bars, rotate above this Red Resistance level and rotate back into it. Now, with the Month of July, we see price struggling near these lows, yet very near to the support channels and Std. Deviation channels, as well as very near to the Purple Tesla Arc. Knowing that we have nearly 2000 earnings data points hitting the markets over the next 3 weeks and the correlation of support/upside breakout analysis that we've identified in the ES and NQ markets, only one analysis can be made for the Transportation Index....
As long as the $10,100 support level holds and the ES/NQ do not break their immediate (YELLOW) support channels, the Transportation Index is setting up to be one of the best buy opportunities (with low risk) that we've seen in a very long time. Yes, there is downside risk should the markets break lower – we understand that. The fact that all of these longer-term charts are aligning with the potential that earning could drive the market to fresh highs, the Transportation Index appears to be one of the most opportunistic setups we've seen so far.

Now, are you ready for these next few weeks with earnings about to hit the markets? Are you prepared to take advantage of these setup and potential moves? Do you understand what we are attempting to illustrate to you and how these types of setups can dramatically improve your trading success?
Want to know how we can help you even more than just showing you these nice charts? Then visit www.TheTechnicalTraders.com to learn how we can help you stay aware and ahead of these markets moves and how our team of researchers can help you find greater success.
The markets are going to move over the next 2~5+ months and our analysis has already shown us that the markets want to continue to “melt higher”. The only concern we have, at this point, is if some external news/crisis event disrupts the price advance and breaks support. If not, then this market should rally from these support levels and attempt new/fresh highs within the next 20~45+ days. Don't miss it.
53 years experience in researching and trading makes analyzing the complex and ever-changing financial markets a natural process. We have a simple and highly effective way to provide our customers with the most convenient, accurate, and timely market forecasts available today. Our stock and ETF trading alerts are readily available through our exclusive membership service via email and SMS text. Our newsletter, Technical Trading Mastery book, and 3 Hour Trading Video Course are designed for both traders and investors. Also, some of our strategies have been fully automated for the ultimate trading experience.
Get our advanced research and market reporting, Daily market videos, detailed trading signals and join the hundreds of other traders that follow our research every day and profit.
Chris Vermeulen Technical Traders Ltd.
Read more by TheTechTrader


