As a continued effort to support and inform our ActiveTradingPartners.com members, we issue regular US Major Market and specific market sector analysis often – usually at least 3~5 times a month. Today, we are focusing on the larger scope of market activity and some of the recent news items that have resulted in increased price volatility in the US markets. We are focusing on the SPY, NASDAQ, US Dollar and the VIX in an attempt to derive forward looking analysis of the US Majors and global markets.
Recently, we have posted a series of research articles regarding VIX Spikes (See : Part #1, Part #2 and Part #3) for our ActiveTradingPartners.com members. Our most recent analysis indicated a potential for a spike on July 19th, 2017 was a dud in the sense that earnings news overrode any attempt at an increase in volatility. Still, the VIX cycle pattern is intact and the next VIX Spike cycle date is August 4th – which is fast approaching. Additionally, key dates in our VIX research are still valid for future dates indicating the potential for massive VIX/Volatility spikes. Key dates are : Aug 4, Aug 23, Sept 11 or 12 and finally Sept 28 or 29.
Keeping this in mind, lets go over some charting data.
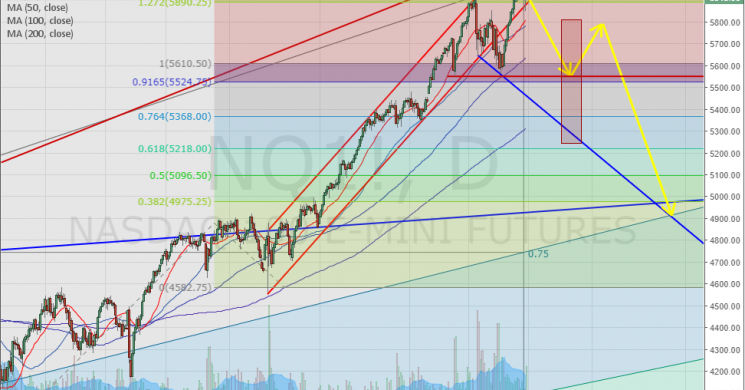
The NASDAQ is showing a massive, and quite narrow, bullish price channel that originated near the recent US Presidential election cycle. The reason we mention this is there is little in historical reference to compare to this type of price action over the past 10+ years in the NASDAQ. The only historical references we could find were early 2012 and late 2013 where US Fed driven rallies were present on the back of QE impetus. It is understood that a new Trump Presidency with the promise of new agenda and infrastructure project would drive this type of price move – but will it continue?
Looking at the Daily NQ chart, we are seeing a potential for a Head and Shoulders pattern setting up. It is far too early to tell at this time if this is a legitimate warning signal or just price rotation. Watching other markets, like the Metals, the US Dollar and Foreign Indexes may provide additional evidence of any major price rotation. What we can derive from this setup is that resistance near 6000 is critical and any current price moves below 5890 would indicate that resistance is strengthening. Key support is near 5550 (the neckline of the Head and Shoulders pattern).


The US Dollar has been showing relative weakness recently (since early January 2017) which may seem concerning for some people. Yet, the longer term US Dollar chart shows this is still a minor retracement within a longer bullish trend. With support near 118 and 116.75, we believe this pullback is relative to the overall trend and a result of US policy and global currency moves. The US dollar is stabilizing in relation to other foreign currencies and searching for support as capital is relocated around the globe in search of returns.
The lower, 0.618 Fibonacci, support channel has continued to provide price support and until this is broken, we don’t believe the US Dollar trend has changed direction. This support level has provided rebounding US Dollar prices at least three times in the recent past (over the past 6 years). It is currently near the 115.78 level.


The VIX chart shows a clear and understood recent expansion of volatility as a result of earnings news for global market/political events. Still not massive in terms of VIX Spike moves – but we believe we are setting up for a much more excessive, almost explosive, move by the September VIX Spike dates.
Remember these dates and plan for them : Aug 4, Aug 23, Sept 11 or 12 and finally Sept 28 or 29.
It is our opinion that the September dates are the most critical and only about 60 days away from now.

The SPY chart, similar in structure to the NASDAQ chart, is showing us a similar price channel – although wider in size and scope. Our research is focused on two key factors that will play out over the next few weeks and months; all Fibonacci expansion levels. Two key Fibonacci factors are at play and, interestingly enough, both are full 100% expansion plays. The first, on the Monthly chart, originates in 2007 and reflects the massive financial market crash of 2008~09. The second, on the Weekly chart, reflects the 2015~2016 price top/bottom and coincides nearly perfectly with the current SPY price highs – near 246.15.


Now that we’ve gone through a number of components that assist us in making research decisions, it is time to come to some conclusion for our readers. This would be an excellent time to revisit the concept of “failure to fail” and “failure to succeed”. First, “failure to fail” indicates that the current “trend failure condition” is never reached and the result would be the current price trend would likely continue (at least for a while). “Failure to succeed” would indicate the current trend patterns fail to continue and a new trend is established. Let that sink in for a minute.
Our analysis is showing we may be at a critical juncture in the markets and that the US and Global markets may be in the midst of setting up massive trend reversal patterns that will play out over the next 30 to 60 days. The Head and Shoulders pattern in the NASDAQ as well as the US Dollar support will likely be tested within this time-frame and we already know the VIX Spike patterns are setting up for some type of massive price volatility between now and September 29. We believe price will dictate the ability to “fail or succeed” and we simply need to be aware of the potential trend opportunities so we can attempt to profit from them.
Here is an example of how our research is used to make decisions about the future market moves. Any weakness in the NASDAQ will likely prompt a downward price swing over the next 30 days (likely ending near August 22~27) towards the 5550 level. At this time, the VIX would likely have spiked 70~200%+ as a result of the NASDAQ falling nearly 7%. This move may put pressure on the US Dollar and the Metals markets as weakness may be felt throughout the global markets. The likely pressure in this case would be to the upside unless the US markets are the root cause of the component failure. In other words, capital is always moving away from hostile environments and towards healthy environments.
We wish we could state with 100% certainty that all of our research and analysis was completely accurate in the future – but that is simply not the case. We provide this research and analysis to inform our valued ActiveTradingPartners.com members and to provide some insight regarding the potential of the US and global markets. Our objective is to deliver the best analysis we can to assist our members in making educated and successful trading decisions. We provide detailed trading triggers, analysis, updates and research to all our members every day and attempt to keep them well informed of the US and global markets activities. Visit ActiveTradingPartners.com to learn more and see how our dedicated team of market professionals can assist your trading. Our portfolio has outperformed the SPY by over 114% this year. Quite a feat when you consider the SPY is up nearly 9% this year and has almost gone straight up since January 2017.
Isn’t it time you invested in your future success? Visit www.ActiveTradingPartners.com today.