Where’s The Gold Going??
As the United States continues to push towards a military conflict with Russia, there will likely be no real winner when the dust settles. However, if we compare the these two superpowers in the current “gold market”, the Russians are the clear winners.
While the U.S. has been (secretly) liquidating its once massive official gold holdings, the Russians have be doing quite the opposite. According to the data on Smaulgld.com, the Russians have added a hefty 3,000,000 oz of gold to its official reserves since the beginning of the year. If you haven’t checked out Smaulgld’s site, I highly recommend it.
In Smaulgld’s article, Central Bank Of Russia Continues To Boost Overall Reserves, here were the monthly additions to Russia’s official gold holdings:
JAN 2017 = +1,000,000 oz
FEB 2017 = +300,000 oz
MAR 2017 = +800,000 oz
APR 2017 = +200,000 0z
MAY 2017 = +700,000 oz
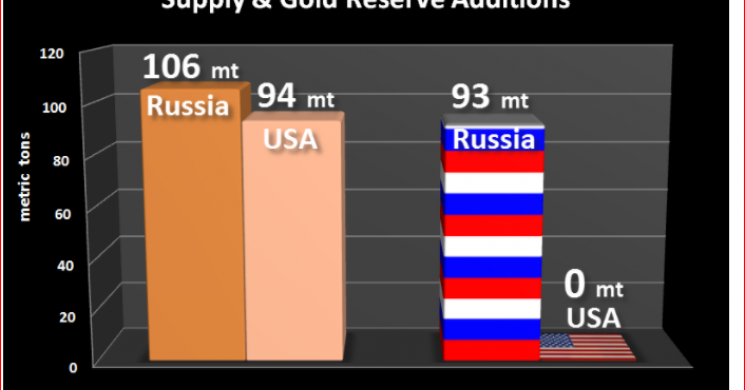
Three million ounces of gold added to Russia’s official reserves is quite a lot of metal… actually 93.3 metric tons. Now, if we compare Russia & the U.S. in gold mine supply versus additions to official gold holdings, this would be the result:

The gold mine supply figures for Jan-May 2017 are based on the last years production data (GFMS 2017 Gold Survey) and the USGS March 2017 Gold Mineral Industry Survey. As we can see, of the estimated 106 metric tons (mt) of gold produced by Russia Jan-May 2017, they added 93 mt to the official gold reserves, versus the U.S. which produced 96 mt, with a BIG PHAT ZERO added to its official reserves.
Basically, Russia’s official gold reserve additions Jan-May 2017 accounted for 88% of its domestic mine supply. Whereas, the United States continues to export all of its gold supply.
Again, using an estimate based om the USGS March 2017 Gold Mineral Industry Survey, the U.S. will suffer a 26 mt gold supply deficit for Jan-May 2017:

For Jan-May 2017, U.S. gold mine supply is forecasted to be 94 mt, imports to reach 118 mt, while total exports are estimated to be 238 mt. Thus, this leaves a 26 mt supply deficit. If we look at the actual data for Jan-Mar 2017, the U.S. mine supply was 54 mt, imports of 71 mt and total gold exports of 143 mt. This leaves a supply deficit of 18 mt for the first three months of 2017.
So, here we can see that the United States continues to export more gold than it mines and imports. However, Russia is doing the opposite and continues to add to its official gold reserves.
If we consider that Russia exported approximately 7,000,000 barrels per day of oil in May, this was a total of 217 million barrels of oil. The total cost of the 700,000 oz of gold that Russia added to its reserves in May was approximately $817 million (based on Kitco’s May average of $1,245). Thus, Russia only had to make $4 profit for each barrel of oil it sold in May 2017 to make purchase the 700,000 oz of gold.
Now, let’s compare this with the United States. The U.S. would have likely imported a net 4,500,000 barrels of oil per day in May. This is a total of 139 million barrels at a cost of $7 billion (based on Brent crude price of $50). Furthermore, the U.S. Government monthly deficit in May 2016 was $55 billion, but I believe it will be even higher in May 2017, when the U.S. Treasury releases the data.
You see, the U.S. Government cannot buy any gold because it continues to run a fiscal deficit, while the country suffers ongoing trade deficits. A country can only add gold if it has SURPLUSES… not DEFICITS. This is why the U.S. continues to print the DOLLAR to continue business as usual.
The U.S. is in serious trouble as it uses extreme leverage in financial and economic markets. When this leverage finally cracks, those holding real gold and silver will experience the insanity taking place in the CRAZY CRYPTOCURRENY MARKET.
Check back for new articles and updates at the SRSrocco Report.
Read more by Soren K.Group


