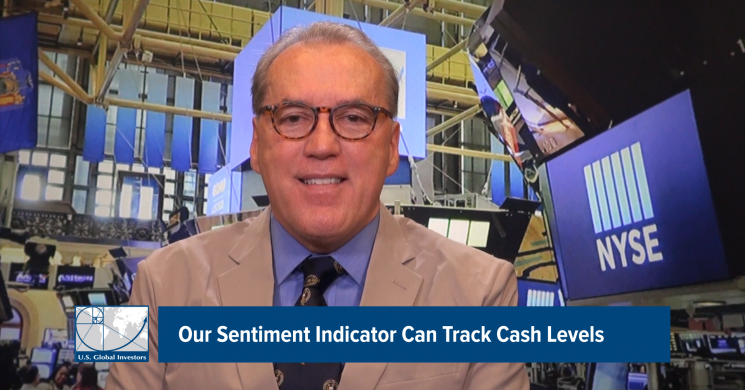
The U.S. Global investment team created a sentiment indicator of 126 indices, sectors, currencies, commodities and markets to measure cash flow levels and volatility. Frank Holmes explains how members of the team use this indicator to monitor the percentage of positions that have five-day moving averages above or below the 20-day moving averages, in relation to the S&P 500. This week the indicator fell below 20 percent which Frank views as a signal that markets are oversold and that now could be a time to buy.
For Frank’s full explanation, watch the video below!
Want to learn more about what’s moving U.S. markets? Read Frank’s latest commentary, Take the Long-Term View in a Late-Cycle Market.
Frank Talk Live features U.S. Global Investors’ CEO and Chief Investment Officer Frank Holmes as he dives into a new investment topic, from gold mining and global resources to digital currencies and emerging markets. Tune in weekly for updates on these key financial markets.
Want more market insights from Frank Holmes? Subscribe to his award-winning CEO blog Frank Talk by clicking here.
----------------------------------------
All opinions expressed and data provided are subject to change without notice. Some of these opinions may not be appropriate to every investor.
The S&P 500 Stock Index is a widely recognized capitalization-weighted index of 500 common stock prices in U.S. companies.
U.S. Global Investors, Inc. is an investment adviser registered with the Securities and Exchange Commission ("SEC"). This does not mean that we are sponsored, recommended, or approved by the SEC, or that our abilities or qualifications in any respect have been passed upon by the SEC or any officer of the SEC.
This commentary should not be considered a solicitation or offering of any investment product.
Certain materials in this commentary may contain dated information. The information provided was current at the time of publication.
Read more by Frank Holmes