We've been warning our followers not to become frightened by price rotation in the US majors for months. Our predictive analysis has been showing us the upside in this market is far from over and our most recent analysis of the global markets is showing us that emerging markets and many global markets may be “disconnecting” from the US majors in a dramatic price move. See our most recent research posts for more on this potential crisis in the making.
Today, we want to alert you to the fact that the move in the US majors may not be over and we could be looking at many weeks or months of upside price bias with some 3~6% price rotations going forward. As we've been trying to warn our followers, there are a bunch of “top sellers” in this market because many believe this market is well overextended and has already reached an Elliot Wave 5 completion. Our analysis is saying this is simply incorrect and these professionals are failing to see the alternative perspective in the markets. What if their “completed wave 5” is really just a larger “Wave A” formation or a completed Wave 3 or 5 – which would lead to much higher and longer upside price potential than anyone has imagined.
Still, with a bit of a chuckle, we read the news that some of these professionals were taking larger positions as “short sellers” and read their comments about “this is it – this is the top of the market”. We posted our analysis and stood by our belief that this market continues to have upside potential and the reasoning behind our belief is relatively clear. The global markets have been primed by more than $16 trillion in quantitative measures and many foreign and emerging markets have squandered the opportunity to secure solid fundamental economic opportunities for their future. Very few global economies have the capacity for growth that the US and other mature/major markets have. It is because of this current economic situation that the US and other mature/major markets will be viewed as the “only suitable economic investment on the planet” for a while and capital will continue to run into these markets as a source of protection and returns.
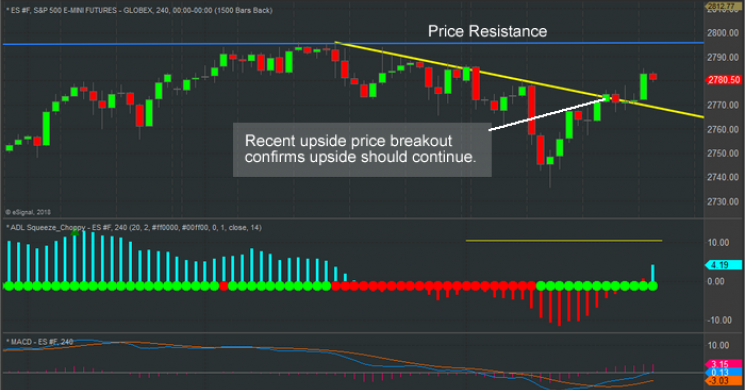
This ES (E-Mini S&P) chart (240 minute) shows the recent price decline over the past week that had many people very worried about a massive top formation. You can see this decline was relatively muted compared to the previous upside move. Over the past few days, the ES retested and broke above the downward resistance channel (in yellow) and is headed back towards the Price Resistance level just below 2800. This price level is likely to be reached within a few days and breached as the ES, YM, and Transportation related markets should push dramatically higher over the next few weeks.

This NQ 240 minute chart shows the same time-span, yet it shows the dramatic upside price breakout in the technology, pharma, and small-cap related indexes. Why are these markets a large driving force in this upside rally? Because capital is searching for suitable investments in US equities for protection and gains. Many of the FANGS and other major market symbols have already seen huge gains over the past 4+ year, yet there are hundreds of other suitable, less pricey symbols available in the realm of Small Caps, Technology and Biotech/Pharma and others. Simply put, money is hunting for US based investment in suitable companies for simple reasons – protection from currency devaluations, protection from political turmoil and potential returns. There is only one place to go, the US stock market.

Lastly, we want to warn our followers that the NQ may stall a bit in an upside bias over the next few days or weeks while the ES, YM, and Transport related equities see bigger gains over the same time-span. It is our opinion that as this rally continues, the NQ will likely see a bit slower price acceleration as the DOW, S&P and Transport stocks pick up momentum. We are not saying the upside move in the NQ is over. We are suggesting that it may be a bit more muted going forward while other symbols pick up the slack and rally higher.
Our valued members get access to clear and direct predictive analysis using our proprietary Adaptive Learning price modeling systems. This helps them know what to expect Days, Weeks and even Months in advance. Our ADL price modeling system is telling us that our analysis future NQ price activity consists of 17 instances of correlative price data that average between 80% to 97% predictive probability of success going forward 20 price bars. To simplify this for our readers, we have a future price analysis with an 85% to 95% probability of success given 17 instances of similar price data.

Our members are uniquely positioned right now to take advantage of this without excessive risk. We will continue to evaluate new trades with regards to the potential for success while considering risk. Our objective is to not overweight our positions too heavily into one aspect of the market.
Although, we will add that once confirmation of this move is evident, we may find multiple opportunities for quick profitable trades for our members. Get ready for some exciting price action and for this next move which most people are not expecting.
Our articles, Technical Trading Mastery book, 3 Hour Trading Video Course, and our Trade Alert Newsletter are designed for both traders and investors to explore the tools and techniques that discretionary and algorithmic traders need to profit in today’s competitive markets. Created with the serious trader and investor in mind – whether beginner or professional – our approach will put you on the path to win. Understanding market structure, trend identification, cycle analysis, volatility, volume, when and when to trade, position management, and how to put it all together so that you have a winning edge.
Join Us This Weekend and Trade Your Way To Wealth This Summer!
Read more by TheTechTrader


