- The Ratio of Gold to Silver is Reaching Resistance
- The last time this occurred Silver Rallied 53%
- Gold and Silver Prices are Consolidating
Gold prices have been stabilizing and have outperformed stocks and bonds as volatility has picked up. While gold did lose 4% since hitting a high in mid-January, the large cap S&P 500 index dropped approximately 11.5%. What this should tell you is that diversification will allow you to achieve the most stable returns over the long term. With the ratio of gold to silver reaching resistance, silver prices are poised to surge.
Gold prices continue to consolidate at the upper end of the current range and many technical indicators describe consolidation. Gold bullion prices ran into resistance near the $1,365 level which coincided with the May 2017 highs, as well as the 38% Fibonacci retracement level. Support is seen near the 10-week moving average near $1,315. There is additional longer-term support which is an upward sloping trend line that connects the low in December of 2016 to the lows in December of 2017 and comes in near $1,275.
Gold Price Chart
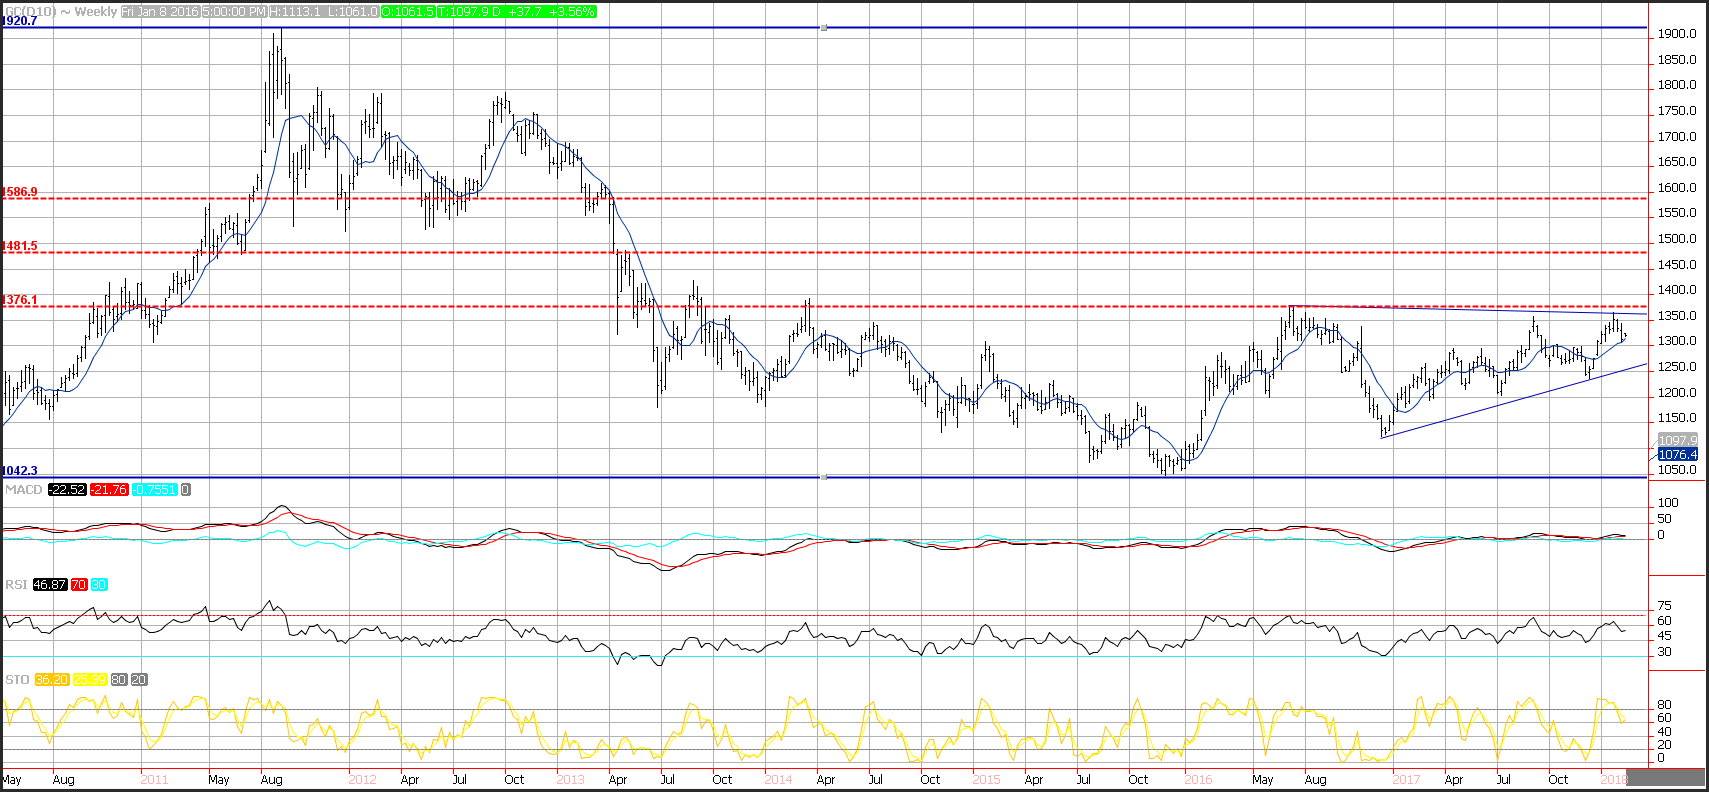
Momentum is now neutral. All-three major momentum indicators point to neutral momentum. The MACD histogram is now printing near the zero-index level with a flat trajectory which points to consolidation. The relative strength index (RSI) has formed a triple top which reflect decelerating positive momentum and potentially accelerating negative momentum. The current reading of 47, was created from sideways price action which also reflects consolidation. The fast stochastic has dropped from overbought territory and is printing a reading of 61, which is in the middle of the neutral range and also moving sideways reflecting consolidation.
Silver Price Chart
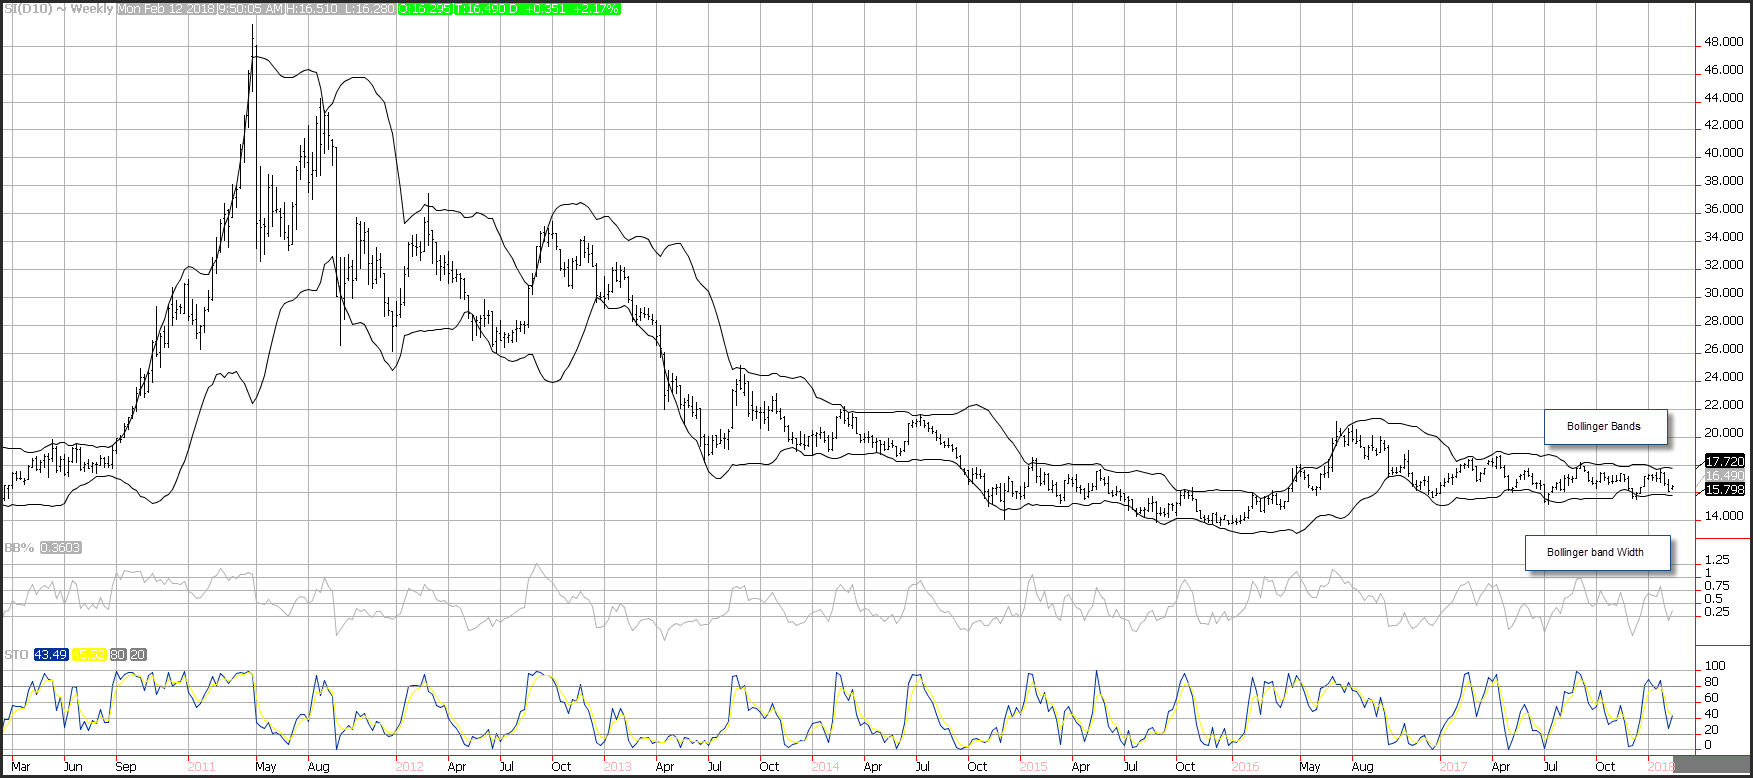
The weekly chart of silver is subdued, and likely represents a buying opportunity. The longer-term range of weekly silver bullion prices is encapsulated by the Bollinger bands, which is a measure of 2-standard deviations around a 20-week moving average. Prices appear to be bouncing near support which is the Bollinger band low at $15.79. Resistance which is the other end of the range, is the Bollinger band high, which is 2-standard deviations above the 20-week moving average near $17.72.
Historical volatility appears to have hit a low on silver bar future prices. This is reflected by the low levels of the Bollinger band width which subtracts the Bollinger band high from the Bollinger band low. Since both are generated from the standard deviation of the mean, you can generate a measure of historical volatility. The current reading of 0.36 is at the low end of the neutral range, will likely climb if prices test resistance. Momentum is neutral which is reflected in the choppy action of the fast stochastic. This momentum oscillator is printing near 44, which is in the middle of the neutral range and reflects consolidation.
Spread Between Gold and Silver Chart
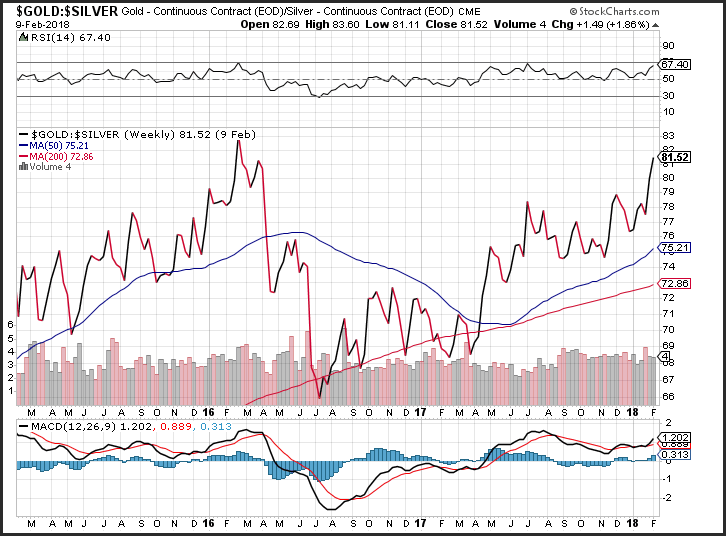
Gold prices continue to outperform silver bullion prices. The ratio between gold bullion prices and silver bar prices moved higher in the latest week, climbing to $81.52 per ounce, the highest level seen since February of 2016. As a point of reference, this was a low point for both gold and silver over the past 2-years. During the rally silver outperformed gold. Gold rallied 30% which was eclipsed by the 53% rally in silver bar prices.
Momentum on the ratio on a weekly basis has turned positive as the MACD (moving average convergence divergence) generated a crossover buy signal. This occurs as the MACD line (the 12-week moving average minus the 26-week moving average) crosses below the MACD signal line (the 9-week moving average of the MACD line). The MACD histogram is now printing in the black with an upward sloping trajectory which points to gold outperforming silver. As the ratio reaches an RSI reading of 70, the spread will likely top out.
If you are interested in finding out more about how you can purchase precious metals click on this link to get access to your free Precious Metals Investment Kit or better yet, give us a call today at 800–982–6105.
Good Investing,
Treasure Coast Bullion Group
Read more by Treasure Coast Bullion Group, Inc - Staff Writer


