
Gold prices consolidated this past week unable to push higher, as the dollar remain buoyed which capped the upward trajectory of gold prices. The daily chart shows a breakout into a consolidation pattern, which is confirmed by the weekly chart that gives one a broader view of gold bar prices. The weekly chart of gold bullion futures shows that prices are forming a weekly bull flag pattern which is a pause that refreshes higher. Support on the yellow metal is seen near the 10-week moving average at 1,297. Resistance is seen near a downward sloping trend line that comes in near 1,352. A break of this level would lead to a quick test of the 2014 highs near 1,400.
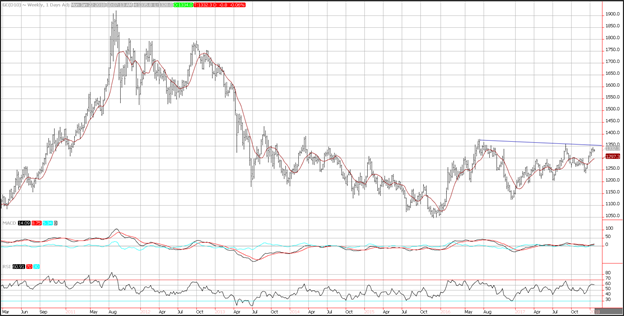
Momentum remains positive as the MACD (moving average convergence divergence) histogram, which is a momentum indicator, is printing in the black with an upward sloping trajectory which points to higher prices for the yellow metal.
The relative strength index (RSI) is key to the next breakout and will describe momentum as prices attempt to push through trend line resistance. The RSI is moving sideways which is a sign of consolidation. The current reading of 60 is on the upper end of the neutral range but the sideways movement of the RSI reflects consolidation.
Silver Price Chart
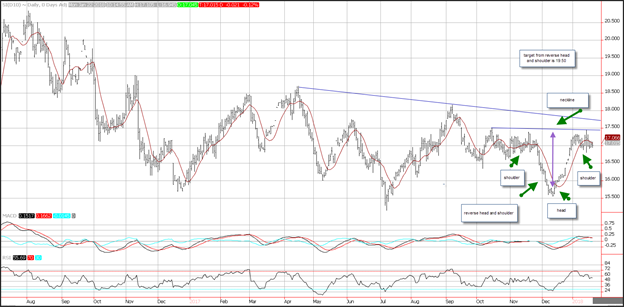
Silver prices continue to form a bull flag pattern, but are also forming an inverse head and shoulder pattern. This type of pattern forms at the bottom of a range as prices look to form a bottom and break out. The reverse head and shoulders are viewable in the chart above and a break of the neckline would is seen as resistance near $17.50, would lead to a test of the $19.50 level. This is calculated by adding the difference between the reverse head to the neckline (which is $2 per ounce) and adding that number to the neckline. This would also require that prices break through downward sloping trend line resistance that comes in near $17.75. Support is seen near the January lows at $16.80.
Momentum has turned neutral as prices have consolidated. The MACD (moving average convergence divergence) histogram is printing near the zero-index level with a flat trajectory which reflects consolidation. The RSI is moving sideways reflecting neutral momentum, as it prints a reading of 56, which is in the middle of the neutral range and reflects consolidation.
Spread Between Gold and Silver Chart
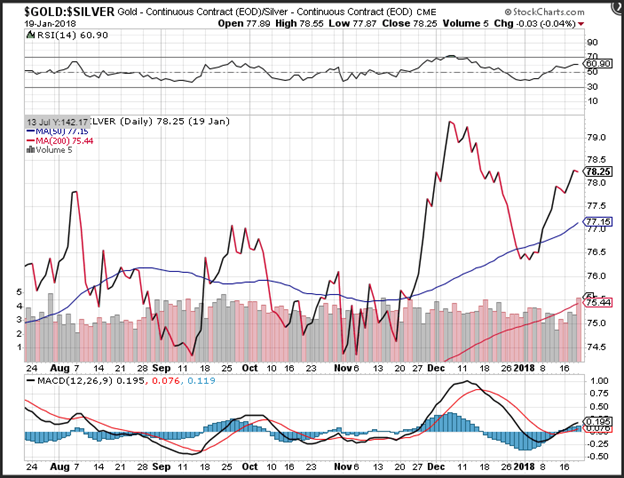
The rebound in the ratio of gold bar prices and silver bullion consolidated last week. So far in 2018, silver bars have underperformed gold bullion by approximately 2.5%. The ratio moved sideways in the past week as traders look to see if global growth is the driver of silver prices, compared to the dollar continuing to lose ground. Support is seen near the 50-day moving average at 77.15.
Momentum on the ratio has turned positive which is a good sign for those who believe gold bullion will continue to outperform. The moving average convergence divergence (MACD) generated a crossover buy signal as the MACD line (the 12-day moving average minus the 26-day moving average) crosses above the MACD signal line (the 9-day moving average of the MACD line). The MACD histogram is now printing in the black with an upward sloping trajectory and combined with the recent MACD buy signal points to a higher ratio.
Good Investing,
Treasure Coast Bullion Group
Read more by Treasure Coast Bullion Group, Inc - Staff Writer


