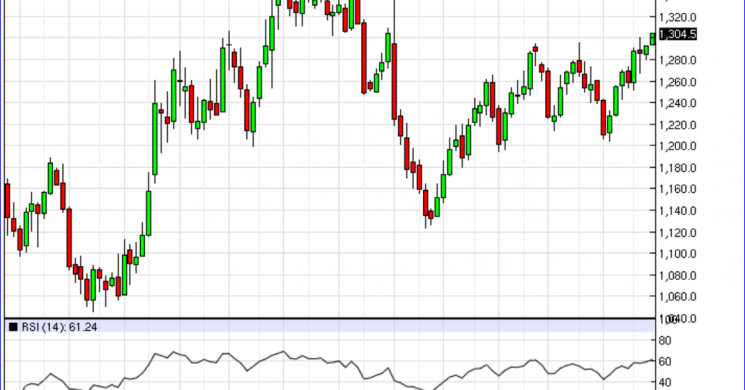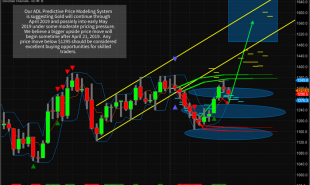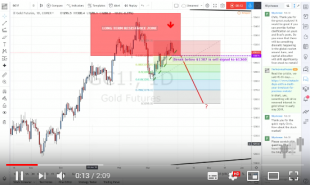
Update:2:15- Moor Analytic $1315 target attained.
As we write this, Gold is on its highs at $1309.90 with room to move. It would seem buyers 2 Fridays ago were indeed trapped longs who likely sold it in the hole last Friday when the market held. We wanted a bull flag to form starting with a selloff early last week, as opposed to the one at week's end, and said as much on Aug 21st;
Ideally, over the next 3-5 days: we wanted to see Gold fill the Comex gap underneath, and in the process shaking out some weak longs and luring some shorts to pile in. First touching the $1285 area, close with a positive settlement on a lower day. Then we could see a nice orderly rally out of a bull flag. But so far that is not the case. Instead we have more buying at the top end of a range that has earmarkings of Friday's behavior.
Our time frame was good. Our order of events was not. The rally / dump 2 Fridays ago did spook us, but last Friday's sell-off and rally undid that. The Comex gap got filled underneath as we wanted, and the market closed positive on the 25th, leaving a tail of sellers trapped below. Happy to be wrong timing wise here about the momo money bailing. from the same post:
If we do not close higher today, they may bail given their gnat-like tolerance in metals. Traders with a 6 month horizon may find themselves annoyed by the funds with a 6 minute horizon right here, right now. We fear the supernova spike/reversal right here and feel the market is much more likely to extend higher on a more sustainable basis if it consolidates a bit here and takes out some weak longs. We prefer the market establish a base here.
Friday's spoof/spike likely shook out the weak longs that piled in prior. So we got our wish.
Next stop: according to Moor Analytics' numbers should be $1315 before we run into selling.
GOLD DAILY
interactive Charts HERE
Moor Analytics
Find below Moor Analytics' Weekly Macro Report. Note Michael uses previous moves as basis for retracement moves. He frequently uses this approach to quantify macro trends in a time-specific way. His time frames are macro to micro. If you are a frequent reader as we are, you may see much of the first parts repeat. This is necessary for context and new subscribers. The new material can be found usually at the end where nascent trends or counter-trends begin. Daily reports are much more detailed in the unfolding of trends in real time and we encourage readers to patronize the firm at no benefit to us.
Right now he views the trends ranked by time in the following manner:
- The Bear Trend of Sept 2011 started at $1911.40. Correction of that sell-off was the rally from $1046.80 to $1375.40. The rally to $1375.40 itself then corrected lower to $1124.30.
- The move higher from $1124.30 NOW is an attempt to retrace the previous move higher to $1375.40. Possible areas of exhaustion for this relief rally come in at $1314- $1323 and $1346- $1355
Which brings us to current events in the report written last night:
The decent trade back above 12920 (+ 1 tic (10 cents) per/hour) warns of decent short covering—likely back toward 13150 (+). We have seen $12.5 of this so far. This line will come in at 12948 (+1 tic per/hour starting at 8:20am). Decent trade back below will negate the short covering bias.
Implications for bulls now are to be long against $1294.80 on a rising trend line with expectations of a short covering rally closing in on $1315 as its target. As Michael's work is prone to call big macro moves quite well, we'd suspect that an eventual piercing of his $1375.40 would put us in a whole new bull market from a macro perspective. Right now his work is doing just fine conveying correction and retracement levels. The point is, these are very good trade-able levels we use for 5 to 30 day positions.
Macro Gold Report
via Michael Moor of Moor Analytics
Gold (Z) 8/28/17
On a macro basis: On a higher time frame, the move up to 13754 from 10468 in December of 2015 is a correction against the bear trend from 19114 in September 2011 down. On a medium timeframe, the move up from 11243 is a correction against the move down from 13754 on 8/2/16. Areas of possible exhaustion for this move up come in at 13143-237 and 13466-556. The maintained gap higher on 7/18 left a medium term bullish reversal intact below that warned of higher trade for days. We have seen $67.8 of this so far from (Q) into (Z) with a roughly $7 spread differential. This has been on hold since we broke below the 12978-88 and 12954-60 areas, but this is now OFF hold as we broke below the 12919 line mentioned below and back above. The solid penetration above 12417-21 warned of solid short covering in the days/weeks ahead, with a good likelihood of a run back up toward 12980 (+). We have seen $63.8 of this so far, taking out 12980 on 8/11. This has been on hold since we broke below the 12978-88 and 12954-60 areas, but this is now OFF hold as we broke below the 12919 line mentioned below and back above. Decent trade above 13193 (+1 tic (10 cents) per/hour starting at 8:20am) will project this upward $36 (+); but if we break above here decently and back below decently, look for decent profit taking. The decent trade back above 12920 (+ 1 tic (10 cents) per/hour) warns of decent short covering—likely back toward 13150 (+). We have seen $12.5 of this so far. This line will come in at 12948 (+1 tic per/hour starting at 8:20am). Decent trade back below will negate the short covering bias.
On a shorter-term basis:
The maintained gap higher on 8/17 left the short term bullish reversal warned about below, which warned of decent higher trade. We have seen $11.5 of this before backing off the high. Decent intra-day trade below 12829 will negate this definitively. I warned on 8/18 to be out of longs for the time being if we broke back below the 12978-88 and 12954-60 areas, but this is now back in play. Trade below 12813-808 is a sign of renewed weakness.
We suspect the $1315- $1323 areas Moor alludes to above are tied to a channel occurring between July and October 2016 that formed a cliff before the drop to $1124.30. Whatever the reason, that is where the next congestion lies on a weekly basis.
GOLD WEEKLY
Did You Really Want to Buy Gold? Did you mean to buy stocks?
It would seem that mal-investment is beginning to show its limits. The Fed is starting to feel collateral damage to its decade of poor decisions. Governor Malloy of CT recently stated he made some misallocations of the state's money which are resulting in the current pension crises CT and other states are going through.
Misallocations? Malloy is an elitist crony of the state. A State that has been advocating misallocated of money since it rescued the TBTF banks. Savers have been punished to the tune of over $1trillion while those who could still afford to buy stocks made out like bandits.
There was no organic recovery, only mal-investment, mis-allocation.. call it what you will.
Let's be honest. Central banks are buying Gold hand over fist. But they will not say so upon their own death. That cat will never be out of the bag. The cat remains in the bag, and the bag is in the river. Get ready for a smack down in Gold, as China needs more.
But in the meantime, how much more proof do you need that Gold is indeed the most undervalued asset on earth? And while it may stay that way for years to come, the forces keeping it in check are slowly ceding to the new powers in the east. These are the same powers that view Gold as a physical hedge, not a hot crypto to chase.
Read more by Soren K.Group


