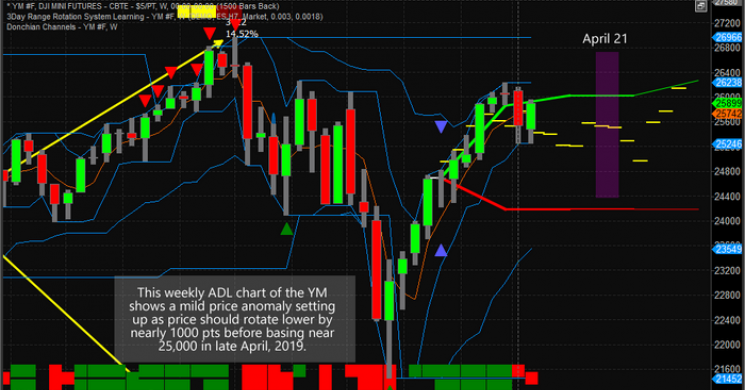
This research post highlights what we believe to be a unique price anomaly setup in many of the US major markets this week. Our research suggests that April 21, or near this date, will be an important price inflection point base level for the US stock markets. We believe a unique price base will begin to form near this date and a bigger price move in May/June 2019 will unfold.
Our Advanced Dynamic Learning (ADL) price modeling system is suggesting the rotation in the US stock market may stay somewhat muted before this move on April 21 begins. The ADL predictive modeling system is one of our proprietary price modeling utilities that our research uses to identify key levels of future support and resistance as well as to watch for “price anomalies” that setup. Price anomalies are where the current price level of any symbol is greatly diverted from the ADL predictive price level. When this happens, the price will usually “revert” back to near the ADL levels at some point in the immediate future – sometimes setting up a great trading opportunity.
This Daily YM chart shows a current price anomaly in the YM of about 1000 points. This is a pretty big range for skilled traders that are capable of identifying the right trade. The ADL system is suggesting that YM will rotate lower between now and the end of April by at least 800~1000 pts.

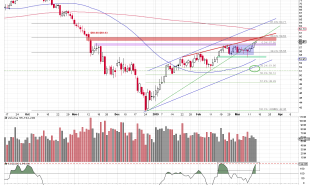
The next, Weekly, YM chart showing the ADL price modeling system is confirming the Daily ADL chart. Both are showing a lower price rotation over the next few weeks. Additionally, the Weekly ADL chart is showing a deep price low near May 1, 2019. This aligns perfectly with our earlier analysis that May/June would start a bigger price rotation in the US stock market, global equities markets and precious metals. More on precious metals forecast in this video clip on TradingView.com

As we continue to move closer to these important dates, we'll keep our followers informed of our research and our proprietary trading tools, yet the real opportunity exists by knowing how to trade these moves and how to take advantage of the total scope of these market. Be prepared for a fairly large downside price swing in the YM over the next 5~7 weeks as the 24,800~25,000 attempts to set up support and a momentum base.
Please take a minute to visit www.TheTechnicalTraders.com to learn more about what we do and how we can help you stay ahead of these market moves. Visit www.TheTechnicalTraders.com/FreeResearch/ to read all of our recent research posts. We take great pride in our ability to provide our members and followers with the highest level of research, trading signals, daily video content and more. Find our why our hundreds of members continue to believe in the opportunity we provide them each and every day. Isn't it time you invested in your future success – today?
Chris Vermeulen


