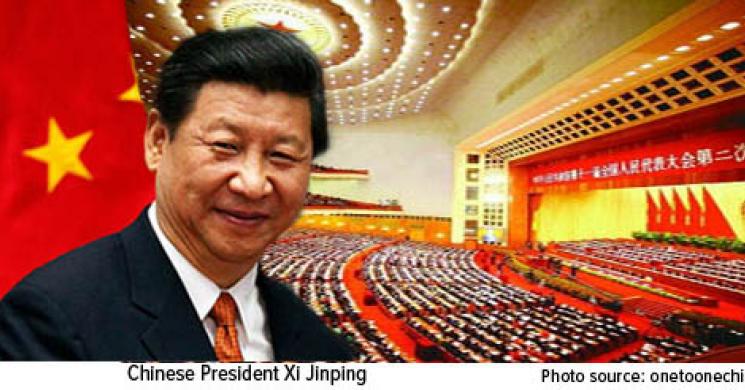
Chinese President Xi Jinping is about to tell millions of government workers: “You’re fired.”
Reuters reported last week that China plans to lay off between five and six million state workers over the next two to three years, in an effort to curb overcapacity in what’s being described as “zombie companies”: those that are being kept alive on bank loans despite bleeding revenue. Close to two million of these layoffs will come from the coal industry alone.
The layoffs are part of a series of sweeping reforms that were announced ahead of the National People’s Congress (NPC) meeting. Every year, close to 3,000 Chinese officials and executives from all over the country convene in Beijing to develop and assess the status of the country’s Five-Year Plan. In response to worldwide demands that China manage its slowing economy better, President Xi Jinping this year has proposed what he calls “supply-side structural reform.”
And if that sounds a little like Reaganomics, that’s kind of the point.
Besides layoffs, Xi’s plan includes tax cuts, deregulation and reductions in state spending—economic policies you might expect to come from the desk of Reagan or Thatcher. We might also expect the results of these policies to be the same in China as in the U.S. and United Kingdom in the 1980s: a boom in entrepreneurship and innovation.
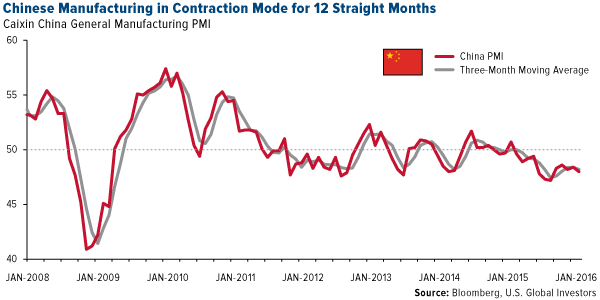
These reforms come at a crucial time for China, whose manufacturing sector has been in contraction mode for a year now as the country’s economy shifts toward domestic consumption. In February, China’s purchasing manager’s index (PMI) fell to 48.0 from 48.4 in January.
 We closely follow government policy changes in China for a number of reasons. For one, its economy is the second largest in the world, and when based on purchasing power parity (PPP), its GDP is actually the largest, followed by the U.S., India and Japan. China’s economy, then, has a huge effect on the rest of the world, touching everything from commodities demand to consumption.
In 2015, total retail sales in China touched a record, surpassing 30 trillion renminbi, or about $4.2 trillion. By 2020, sales are expected to climb to $6.4 trillion, representing 50 percent growth in as little as five years. This growth will “roughly equal a market 1.3 times the size of Germany or the United Kingdom,” according to the World Economic Forum (WEF).
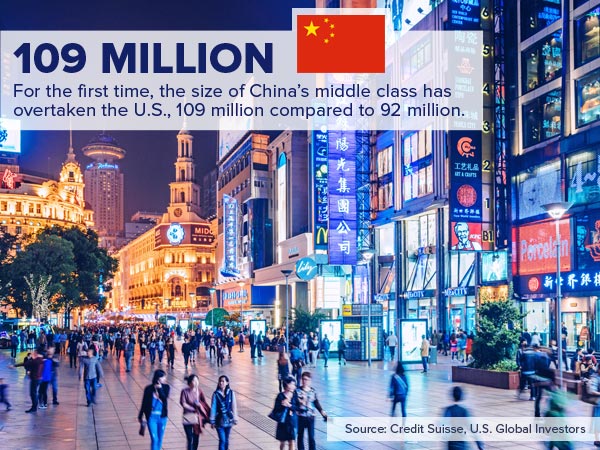
One of the main reasons for this surge in consumption is the staggering expansion of the country’s middle class. In October, Credit Suisse reported that, for the first time, the size of China’s middle class had exceeded that of America’s middle class, 109 million to 92 million. As incomes rise, so too does demand for durable and luxury goods, vehicles, air travel, energy and more.
But middle-income families aren’t the only ones growing in number. The WEF estimates that by 2020, upper-middle-income and affluent households will account for 30 percent of China’s urban households, up from only 7 percent in 2010.
Gold’s Back in a Bull Market at the BMO 25th Metals and Mining Conference
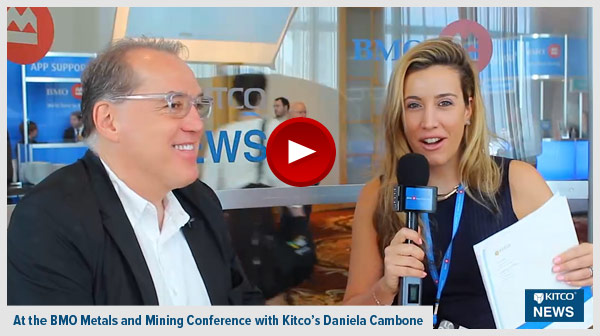
Last week I returned from sunny Florida, where I had been attending the BMO Metals and Mining Conference, widely regarded as the best in the business. Sentiment toward gold was very optimistic, as I told Kitco News’ Daniela Cambone in last week’s edition of Gold Game Film. As always, Daniela did a fabulous job covering the event, interviewing all of the CEOs and other mining executives.
The yellow metal is 2016’s best-performing asset class so far, having climbed more than 19 percent. It just had its strongest February since 1975.
What’s more, gold appears as though it’s back in a bull market, often defined as a 20 percent gain from a recent trough. Short-term, though, it’s way overbought, so a correction at this point would be healthy.
Follow the Money, Follow the Gold Flows
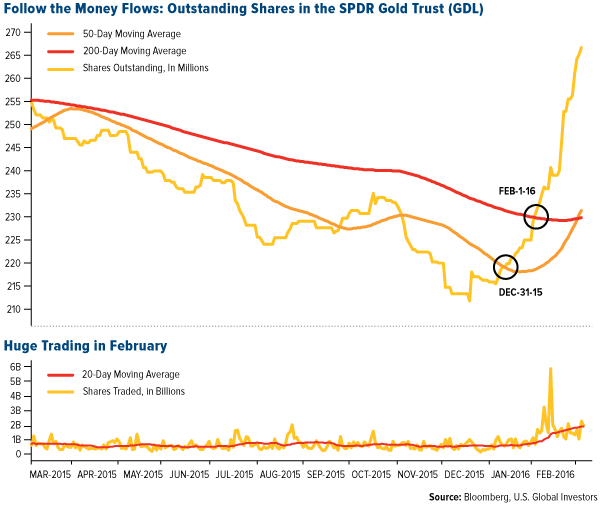
At the BMO Conference, I had the pleasure of meeting and speaking with my friend Pierre Lassonde, cofounder of Franco-Nevada, and company CEO David Harquail. Pierre told me that for every $1 billion that flows into the SPDR Gold Trust (GLD), the price of gold rises approximately $30 per ounce. Since the beginning of the year, we’ve seen about $9.3 billion flow into the GLD. During the same period, gold has risen 20 percent from its six-year low of $1,049.60 per ounce on December 17 to end Friday trading at $1,259.25.
The first breakout signal occurred on December 31, 2015, when money started to flow into gold, and the second important signal was when gold flows surpassed the 200-day, or 10-month, average, on February 1, 2016. Since the beginning of the year, gold has surged.
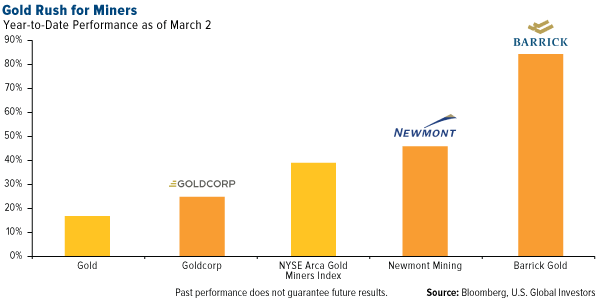
 Like bullion, gold miners had a particularly gainful February, its best since 1998. The NYSE Arca Gold Miners Index rose an impressive 38.7 percent, compared to the 0.4 percent the S&P 500 Index lost in February. Year-to-date, production leaders Goldcorp, Newmont Mining and Barrick—which has recently lowered its debt-to-equity ratio—are thriving with prices pushing higher.
 Gold is surging right now for a number of reasons, many of which I’ve covered in the last few weeks, including stronger inflation, negative interest rates and other components of the Fear Trade.
Global growth concerns have also spooked many investors, driving them into gold’s arms. Last week we learned that the global PMI fell pretty dramatically to a neutral 50.0 reading in February, down from 50.9 in January. Anything below 50.0 indicates manufacturing deterioration, and while I hope we don’t cross into that territory, the PMI has been trending downward over the last two years. We haven’t seen sub-50 readings since 2012.
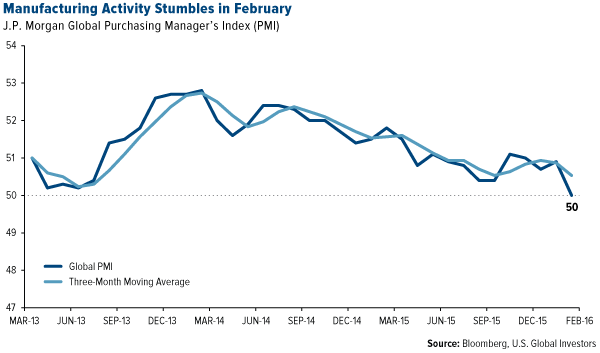 As I’ve discussed many times before, we use PMIs to help forecast global manufacturing conditions three to six months out. (I’ve likened the economic indicator to the high beams on your car, with GDP serving as your rearview mirror.) That the PMI remains below its three-month moving average doesn’t bode well for commodities or energy in the short-term. The weakness underscores the need for global economies to reform their tax systems and relax regulations, as China is attempting to do.
Comparing Countries’ Compliance Complexity
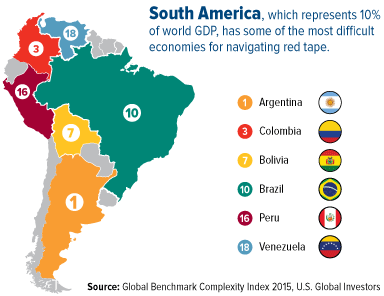
The TMF Group, a professional services firm, just released its annual Global Benchmark Complexity Index, which ranks countries according to the complexity of their business compliance standards. As you might expect, dominating the top 10 most complex governments are those found in South America, including Brazil, Bolivia, Colombia and, at number one, Argentina.
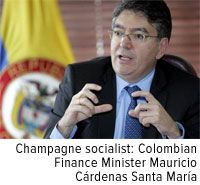
Colombia climbed—or fell, depending on your perspective—18 spots, from 21 to three, mainly due to the tax changes its government rolled out last year courtesy of its socialist finance minister, Mauricio Cárdenas Santa Maria. The South American country is now in the process of raising its income tax incrementally, from 40 percent this year to 43 percent in 2018, and with the agreement of other countries, it may now also tax the wealth its citizens hold in other jurisdictions (very similar to FATCA, or the Foreign Account Tax Compliance Act, here in the U.S.).
For the third consecutive year, Argentina ranks as the world’s most complex country in terms of business compliance. Back in November I wrote about the election of free-market advocate Mauricio Macri, expressing my hopes that the new president can bring significant reforms to the country’s business infrastructure and eliminate corruption. I’m still encouraged, but as we all know, political change is fraught with challenges and can take some time.
It’s a shame that Argentina, Colombia, Brazil and many other resource-rich countries in South America can’t move more quickly to eliminate the roadblocks that stand in the way of growth and prosperity. Brazil, which is on course for its worst recession in over a century, shrank 3.8 percent in 2015, the largest decline since 1990, and its central bank expects it to shrink a further 3.45 percent this year.
Reform would benefit not just their own capital markets but the world economy as a whole. South America represents about 10 percent of the global economy, meaning a 1 or 2 percent rise or fall in GDP could have a significant effect on world GDP.
As a reminder, I will be in Carlsbad, California, April 13-16, speaking at the Oxford Club’s 18th Annual Investment U Conference. I’m honored to be joined by other respected minds in the world of investing, including Alexander Green, Marin Katusa and Keith Fitz-Gerald. Reserve your seats today by clicking the link above. I hope to see you there!
All opinions expressed and data provided are subject to change without notice. Some of these opinions may not be appropriate to every investor. By clicking the link(s) above, you will be directed to a third-party website(s). U.S. Global Investors does not endorse all information supplied by this/these website(s) and is not responsible for its/their content.
The S&P 500 Stock Index is a widely recognized capitalization-weighted index of 500 common stock prices in U.S. companies. The NYSE Arca Gold Miners Index is a modified market capitalization weighted index comprised of publicly traded companies involved primarily in the mining for gold and silver. The index benchmark value was 500.0 at the close of trading on December 20, 2002.
The Purchasing Manager’s Index is an indicator of the economic health of the manufacturing sector. The PMI index is based on five major indicators: new orders, inventory levels, production, supplier deliveries and the employment environment. The Global Benchmark Complexity Index ranks 95 jurisdictions in order of business compliance complexity.
Holdings may change daily. Holdings are reported as of the most recent quarter-end. The following securities mentioned in the article were held by one or more accounts managed by U.S. Global Investors as of 12/31/2015: Newmont Mining Corp.
Read more by Frank Holmes


