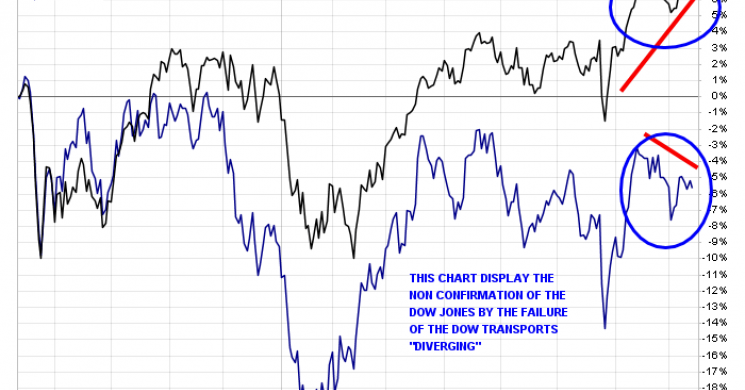
We hope Chris is right for the sake of a return to sound policies. The divergence is real between earnings and stock prices. And it is true that a non hiking Fed may not be enough to keep the boat afloat in La LA Land. We happen to believe that it is precisely that thinking that will be correctly borne out. But not in the order we want. We fear that the market will
- continue to rise on vapor
- A crisis will precipitate Permanent Debt Monetization aka Helicopter Money in Asia and Europe
- a whiff of inflation will ensue but no one will panic
- That will be the excuse for the FOMC to do likewise
- Stocks will explode in a final capitulation of easy money
- The nstocks will not be able to keep pace with USD debasement, even if they go up.
Our citation is from 1920's Germany. That is how it played out. In the meantime. What follows is how markets are supposed to behave and a good explanation on Dow Theory- Soren K.
Written by Chris Vermeulen of TheGoldandOilGuy.com
editor SK
The current overall SPX pattern is a broadening top, which is usually a very reliable pattern. The market continues to look as though it wants to go even lower. The momentum shift, which I have been expecting, has been slow to start, however one should be prepared for this occurrence ahead of time.
Nevertheless, the large divergences which I have been viewing, in my proprietary oscillators, are most real, and, once the selling starts, the momentum should quickly move to the downside.
The current market is being supported by a lack of sellers more so than aggressive buying. With investors still thinking that there is no other place to store their money, they appear to be content with leaving their money with risk-on assets within a market that is pushing to all-time highs.
This type of mentality usually leads to large losses rather than big gains. There isn’t any real opportunity for growth in the SPX that I can see right now.
Dow Theory: Market Indexes Must Confirm Each Other
The Dow Theory was formulated from a series of Wall Street Journal editorials which were authored by Charles H. Dow from 1900 until the time of his death in 1902. These editorials reflected Dow’s beliefs regarding how the stock market behaved and how the market could be used to measure the health of the business environment.
Dow first used his theory to create the Dow Jones Industrial Index and the Dow Jones Rail Index (now Transportation Index), which were originally compiled by Dow for TheWall Street Journal. Dow created these indexes because he felt they were an accurate reflection of the business conditions within the economy, seeing as they covered two major economic segments: industrial and rail (transportation). While these indexes have changed, over the last 100 years, the theory still applies to current market indexes.
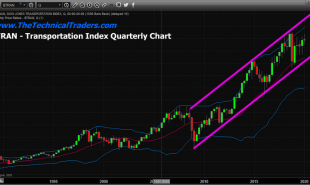
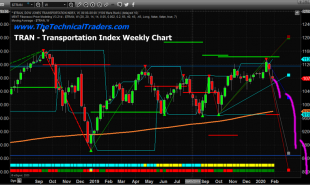
Market indexes must confirm one another. In other words, a major reversal from a bull or bear market cannot be signaled unless both indexes (generally the Dow Industrial and Transports Averages) are in agreement. Currently, THEY ARE DIVERGING,ISSUING A MAJOR NON-CONFIRMATION HIGH ON THE DOW JONES INDUSTRIAL AVERAGE. If one couples this with the volatility index (Fear Index), this is a warning sign and a recipe for disaster.

The FEDs’ monetary policy over the last eight years has led to unproductive and reckless corporate behavior. The chart below shows U.S. non-financials’ year-on-year change in net debt versus operating cash flow as measured by earnings before interest, tax, depreciation, and amortization (EBITA).

The growth in operating cash flow peaked five years ago and has turned negative year-over-year. Net debt has continued to rise, which is not good for companies.
This has never before occurred in the post-World War II period. In the cycle preceding the Great Recession, the peaks had been pretty much coincidental. Even during that cycle, they only diverged for two years, and by the time EBITA turned negative, year-over-year, as it has today, growth in net debt had been declining for over two years. Again, the current 5-year divergence is unprecedented in financial history!
Today, most of that debt is used for financial engineering, as opposed to productive investments. In 2012, buybacks and M&A were $1.25 trillion, while all R&D and office equipment spending were $1.55 trillion. As valuations rose, since that time, R&D and office equipment grew by only $250 billion, but financial engineering grew by $750 billion, or three times this!
You can only live on your seed corn for so long. Despite there being no increase in their interest costs while growing their net borrowing by $1.7 trillion, the profit shares of the corporate sector peaked in 2012. The corporate sector, today, is stuck in a vicious cycle of earnings manipulation management, questionable allocation of capital, low productivity, declining margins and growing debt levels.
Conclusion:
In short, I continue to pound on the table to help keep you and fellow investors aware that something bad, financially, is going to take place – huge events like the tech bubble, the housing collapse a few years back, and now national financial instability. Experts saw all these events coming months and, in some cases, years in advance.
Big things typically don’t happen fast, but once the momentum changes direction you better be ready for some life changing events and a change in the financial market place.
Follow my analysis in real-time, swing trades, and even my long-term investment positions so you can survive from the financial storm
Chris Vermeulen
Popular on MarketSlant Now
- Why Dilbert's Author backs Trump
- Clinton Foundation Gets Ethics: after the fact
- Technical Brief: Silver sell signal, Gold Holds
- Trump Advisor calls for Gold Standard: "Money that transcends borders and time"
Read more by Soren K.Group


