DOW JONES INDUSTRIALS
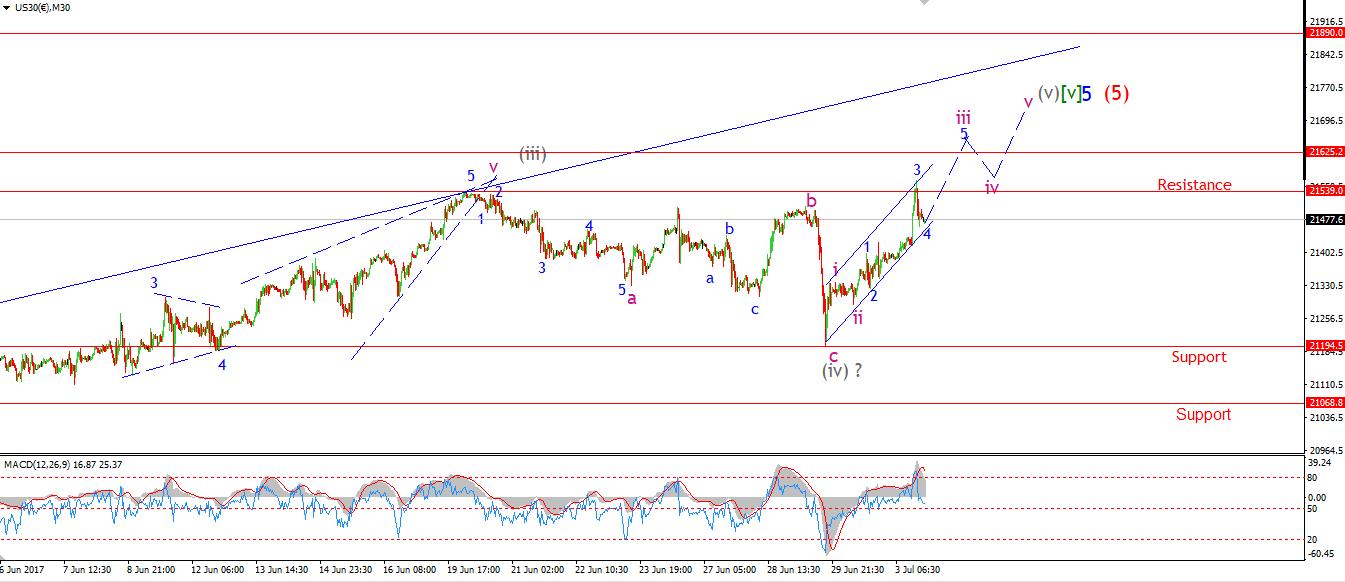
30 min
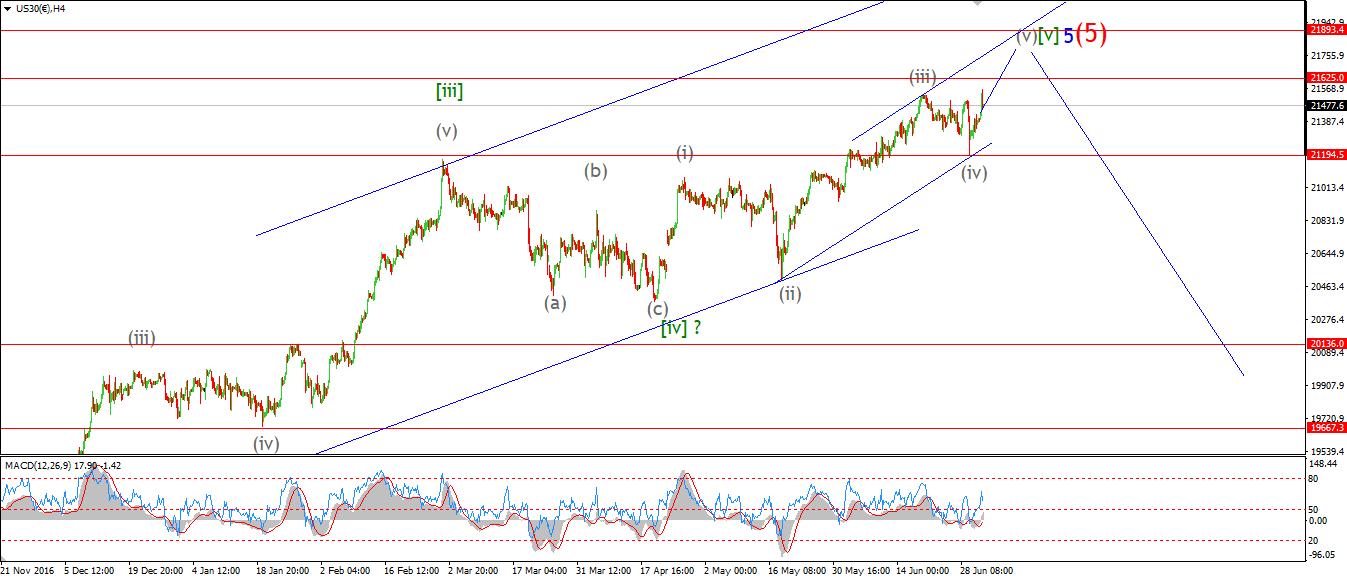
4 Hours
Daily
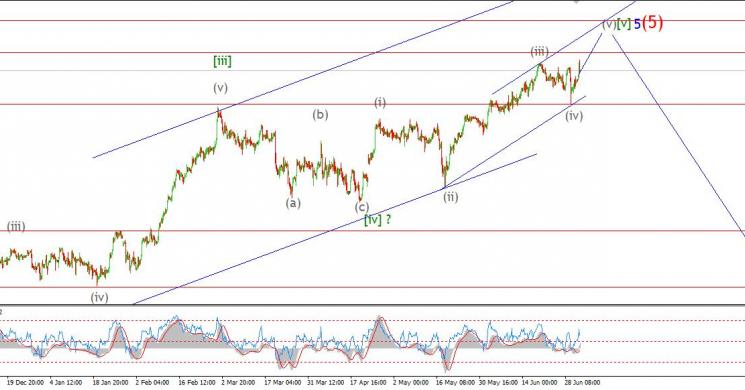
My Bias: market topping process ongoing Wave Structure: Impulsive 5 wave structure, possibly topping in an all time high. Long term wave count: Topping in wave (5) Important risk events: USD: N/A.
Todays pump and dump in stocks has again invalidated the short term bearish count shown on Friday. I have altered the wave count to account for this new all time high.
The market has triggered the alternate wave count which views the recent selloff as a correction in wave (iv) grey. The price is now moving within wave (v) grey.
Each time the price action triggers the alternate wave count, We get one step closer to realising the larger picture, One point should not be forgotten here. The market is closing out a price structure at a very large degree right now, So when it does turn down, as it is bound to do! It is going to turn down for a very long time. This is the reason why I remain vigilant for a turn each and every day. The magnitude of the decline to come dictates a very conservative approach.
So for the rest of this week, I will be looking for the completion of wave (v) grey. Fibonacci analysis puts the top of wave (v) grey between, 21625 - the 162% extension of wave (i) grey. And; 21890 - Where wave (v) grey will reach equality with wave (i) grey.
Both scenarios lead to the same conclusion, The bear market is one step closer.
Read more by Enda Glynn


