INTRO
It should be noted that the author is using a different wave count than the one we post here normally in a series of posts titled "Project $1550" and contributed by Enda Glynn. As of now, That wave count is still (barely) hanging on for dear life. Here is a wave count that must now be considered.
Subjective as EW is: we are not shy in saying that despite the count being valid when Gold was above $1240, we were very concerned adn our final advice was "Flat is where its at" and to buy Gold speculatively on strength above $1259.
The point is, slagging EW is foolish. Using it as a tool like any other in your kit for making decisions is what to do. And we ascribed to the wave count in those posts whole heartedly while maintaining vigilance for other signs.
So if you are inclined to dismiss EW as a whole, then stop reading now. If we sound like advocates of EW, we are not. What we are doing here is pre-empting claims of contradiction by people who do not bother to follow the narrative of EW analysts. More importantly, those who want EW to be an answer key, and alternatively whine they've been deceived.
Here is a pro-tip for that sort: smoke the cigarets that warn of low birth weight. This way you'll not get cancer.
For us, it has taken years to come to terms with first our ignorance of its use, to then understanding it only to be disappointed when it 'changed its mind', to putting in its proper place in our own tool kit as a probability handicapper susceptible to ocular regression and projected biases onto it by the user.
So.. Yea, we still hate EW.. but we know when to let it off its leash and when to muzzle it. In the count below, our intuitions and other analyses were born out. Now the question is : is this count right, or is the "Project $1550 count still valid? WE say who cares? We were recommending flat after the double bottom of $1240 was pierced and saw possibilities of $1220. We didn't spec short or long. Now we see an increasing possibility of an outright drubbing of the Gold down to $1150 under $1214. Why? Because under $1214 we suspect short momentum players will pile in. An the cycle repeats .
Here is our most recent on the "Project $1550" EW count which says we were wary of a swoon to the $1220's. It gives the whole story top to bottom and we feel is a decent example of using EW with healthy skepticism. Anyway, it is all IF/THEN stuff and anyone who tells you they have an answer key is full of it. We are all mushrooms kept in the dark and fed a load of shit. EW is but one candle we use to light the dark. WE hope to update that wave count today. In the meantime, here is the bear count
- Soren K Group
Is Gold Making A Beeline For The 1180.00 Handle?
Key Points:
- The long-term trendline seems to be broken.
- A corrective ABC wave could be seen in the coming weeks.
- Losses could extend to the 1180.00 handle.
via Blackwell Global
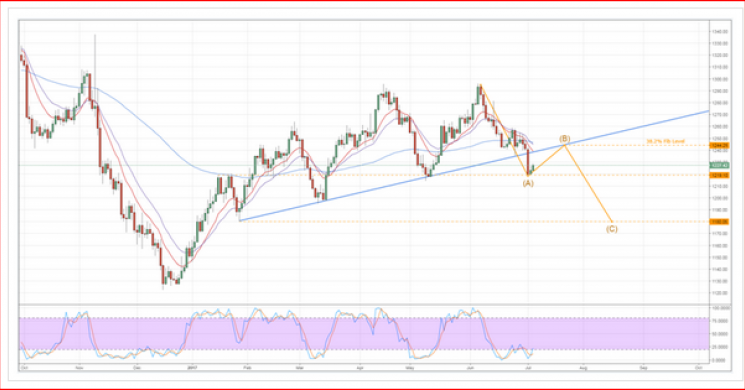
As a result of a breakout below its long-term trendline, has ostensibly confirmed recent fears that the metal’s trajectory is going to be rather bearish moving ahead. Indeed, Monday’s nearly 2% slip has cemented the bias of numerous technical readings that had been suggesting that the metal was in need of a corrective movement. However, exactly what form our corrective decline will take and how far losses will extend is up for debate and is worth taking a closer look at.
First and foremost, the sharp downturn and subsequent reversal tends to indicate that we are going to see an ABC wave over the coming weeks. As shown below, the historical reversal zone around the 1219.10 handle has struck again and looks as though it is going to remain intact – a sign that the ‘A’ leg has completed. Of course, this means we are now moving into the second leg of the pattern which we expect to bring gold prices back to around the 1244.25 handle. This bias is reinforced by the fact that stochastics remain oversold and are in sore need of being relieved.
However, just because we are moving into a near-term uptrend doesn’t mean we are necessarily going to see the metal make the required reversal to start the ‘C’ leg of the pattern. This is where the old trend line comes back into the picture as it is likely to be a source of resistance moving forward. Importantly, this should limit upsides and force gold to retreat at that 1244.25 handle – marking the start of the final leg of the ABC wave.
Once the final leg is underway, the highly bearish EMA bias is likely to be felt once again and encourage the metal to move into a rather steep decline. Furthermore, the 100 day moving average will be providing substantial dynamic resistance as gold retreats, which will limit chances of an intra-day sentiment swing disrupting the overall downtrend. Ultimately, this corrective structure should see the metal move back to around the 1180.00 mark – the lowest point in the first trough seen during the recent uptrend.
Read more by Soren K.Group


