EURUSD
30 min
4 Hours
Daily
My Bias: long term bearish Wave Structure: downward impulse wave Long term wave count: lower in wave (3) red Important risk events: EUR: German Prelim CPI m/m. USD: Advance GDP q/q, Revised UoM Consumer Sentiment.
Hello and good evening to you all.
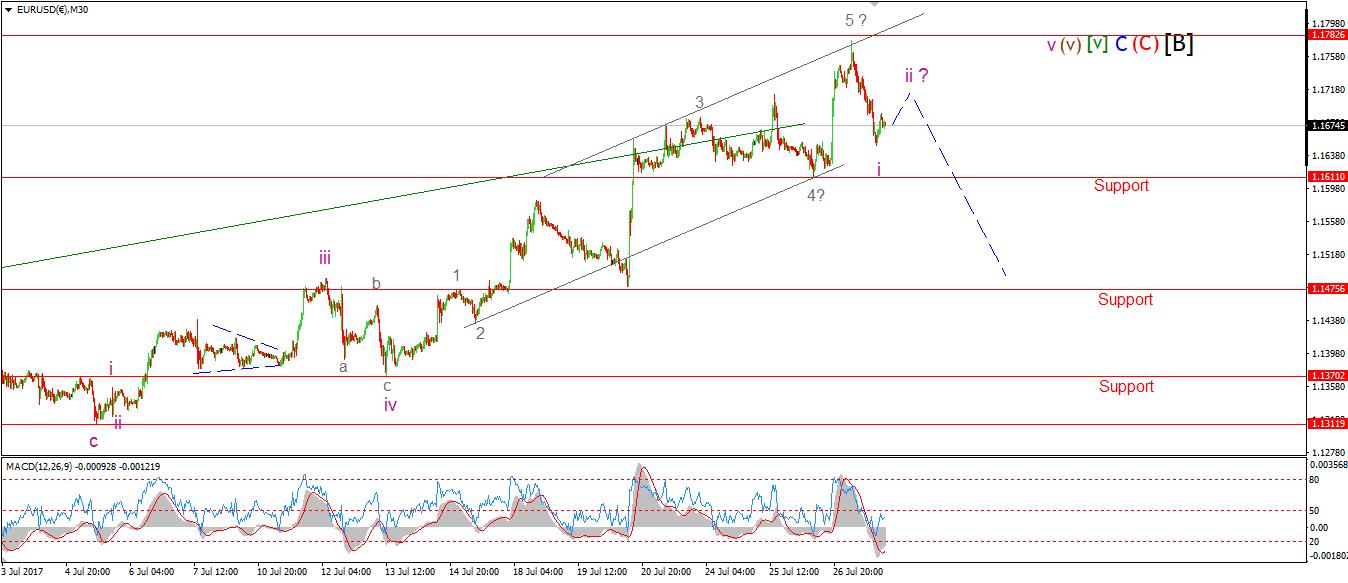
After a rally into the trend line as expected, the price structure has now completed a five wave rally in wave 'v' pink. Last night the target for a top was set at 1.1782. The the overnight high reached 1.1776 and then sold off in a possible impulsive wave structure.
I have labelled that decline with wave 'i' pink, With the general expectation of a major top soon in EURUSD, I feel it is important to remain vigilant.
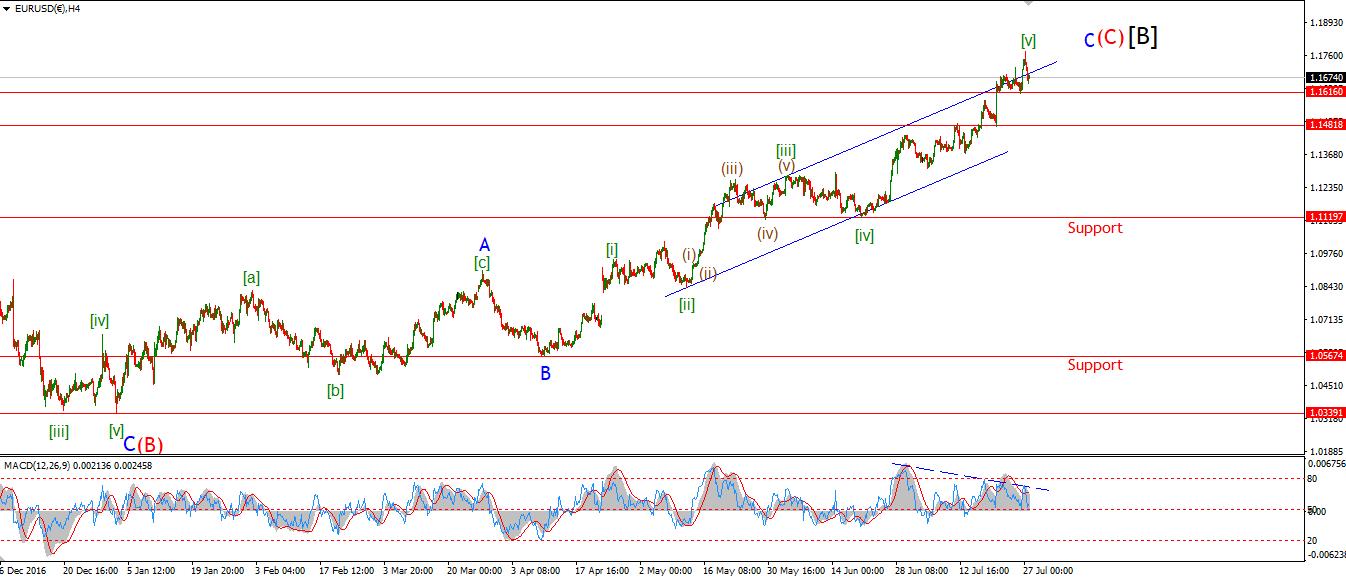
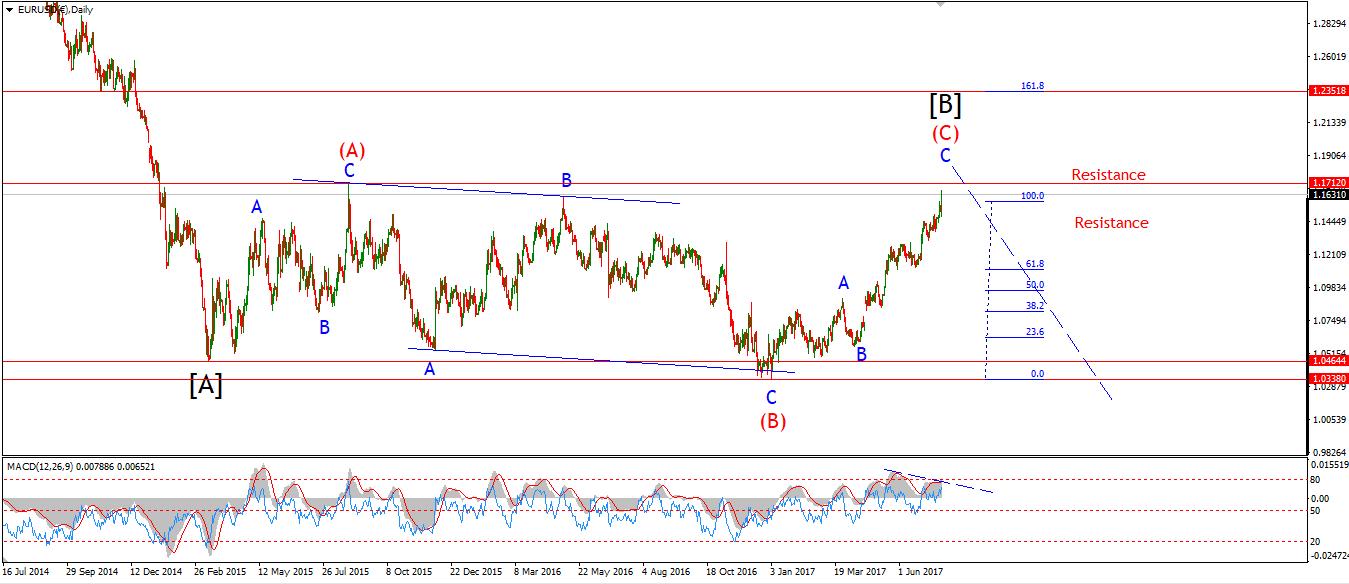
I want to draw your attention to the 4hr chart. The RSI is now on the verge of giving a momentum sell signal by declining through the centreline. The declining trendline has remained intact, And the divergence situation now sits at a critical point. This market has the very real potential to sell off in a big way under these conditions.
For tomorrow; Watch for a three wave correction into a possible wave 'ii' pink. A break of 1.1616 will add weight to the idea of a top in place.
DOW JONES INDUSTRIALS
30 min
4 Hours
Daily
My Bias: market topping process ongoing Wave Structure: Impulsive 5 wave structure, possibly topping in an all time high. Long term wave count: Topping in wave (5) Important risk events: USD: Advance GDP q/q, Revised UoM Consumer Sentiment.
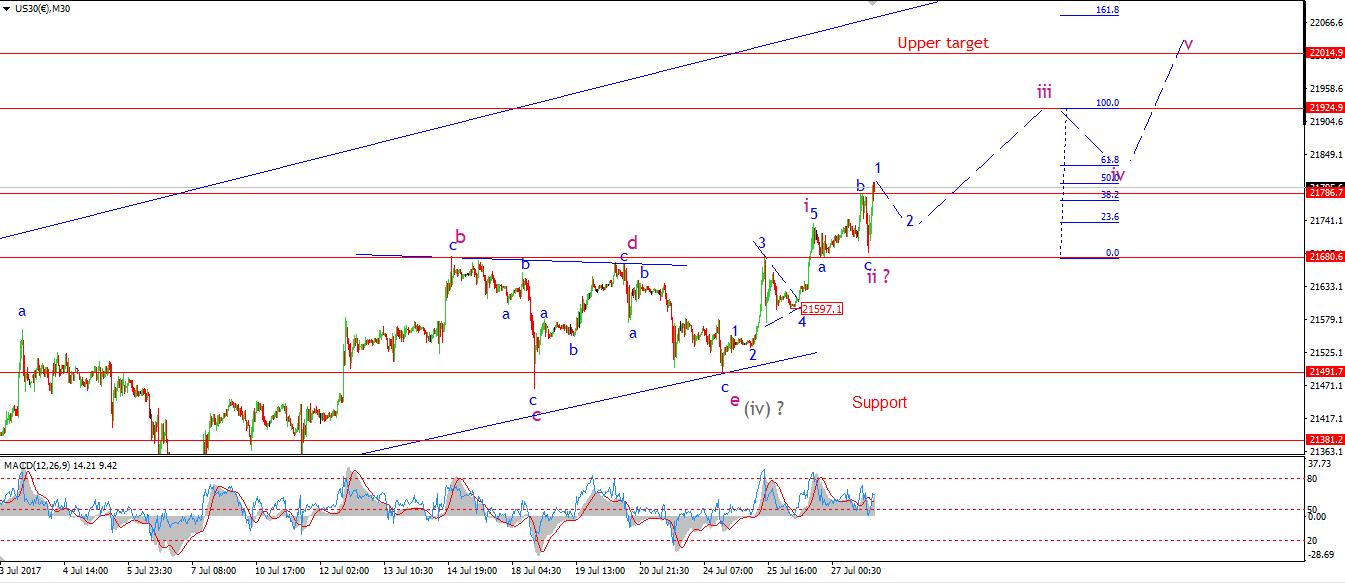
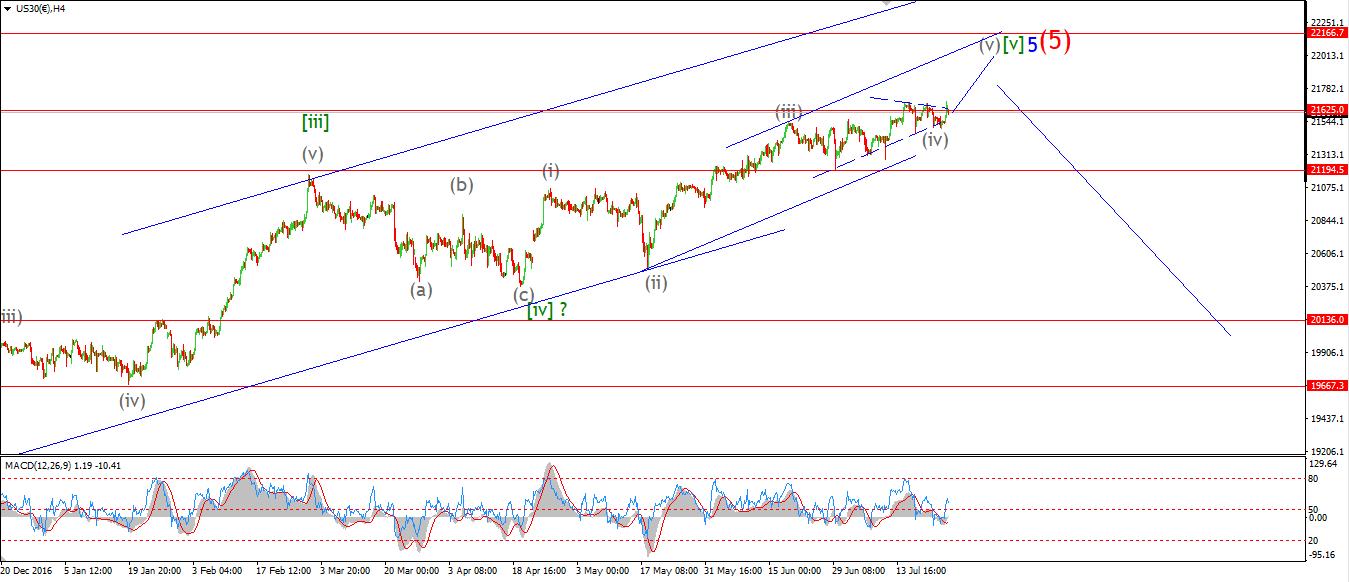
Stocks have remained feverishly bullish all day despite a brief sell-off back to par. I had a hunch that wave 'ii' pink could be brief given the mood in the market. And nothing seems to be deterring the bullish sentiment right now.
I have labelled wave 'ii' pink as complete at todays low And as I write the price just popped above wave 'b' blue to create another new all time high! Of course this is just a healthy market rationally valuing the future cash-flows these companies and investors allocating scarce capital in the most efficient manner - No bubble to see here, move along folks!
As it stands, The price is now rising in wave 'iii' pink, with a minimum target at 21925, This is where wave 'iii' reaches 162% of wave 'i' pink.
for tomorrow; watch for a correction into wave '2' blue as shown, next weeks trade is looking very bright in this scenario.
GOLD
30 min
4 Hours
Daily
My Bias: Long towards 1550 Wave Structure: ZigZag correction to the upside. Long term wave count: Topping in wave (B) at 1550 Important risk events: USD: Advance GDP q/q, Revised UoM Consumer Sentiment.
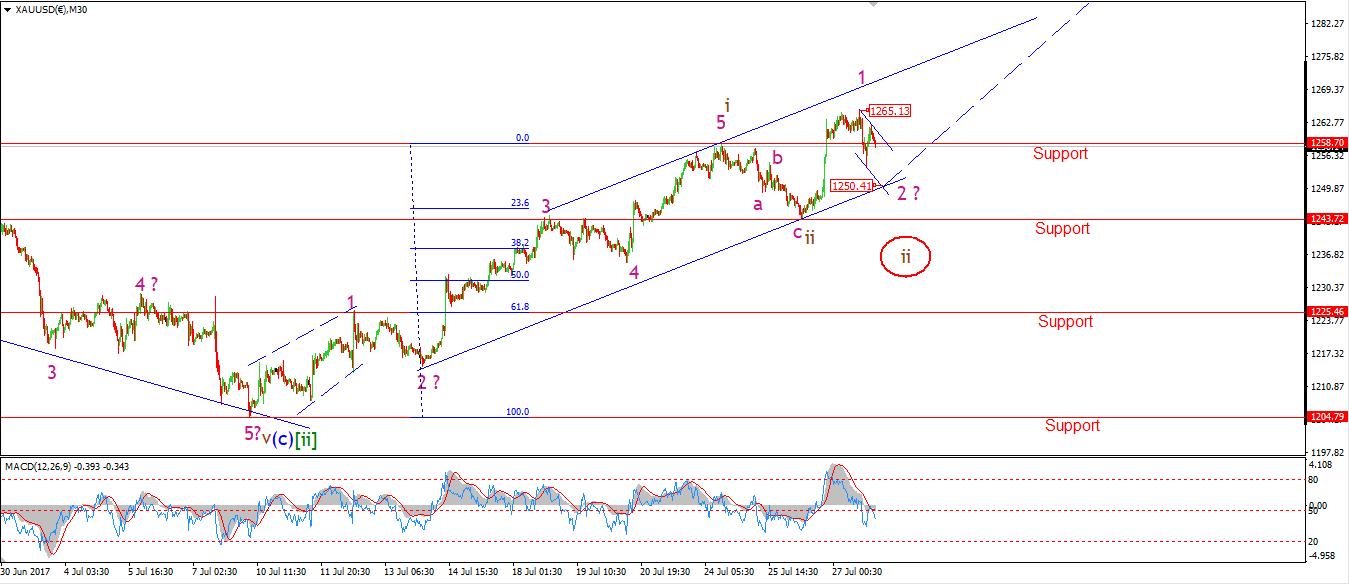
GOLD did manage a higher high this morning to complete wave '1' pink. Although it did not hit the upper trendline, the internal structure is in five waves so this market remains with a fully bullish stance.
The declines this evening may be the beginning of wave '2' pink. I have shown a trend channel around the declines, Wave '2' pink should trace out three waves, so it is likely that the lower trend line will be reached again to complete wave '2' pink. That could happen at about 1250, This is where the price will again meet the larger rising trend channel.
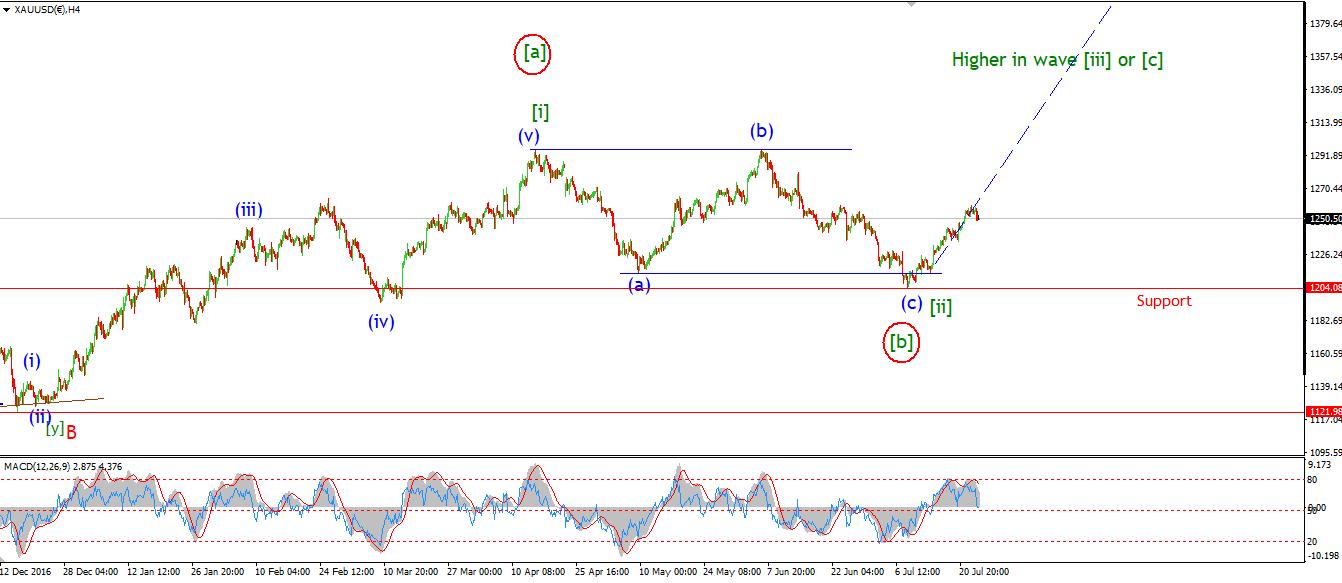
So the outlook is for the market to continue a large rally in wave 'iii' brown next week.
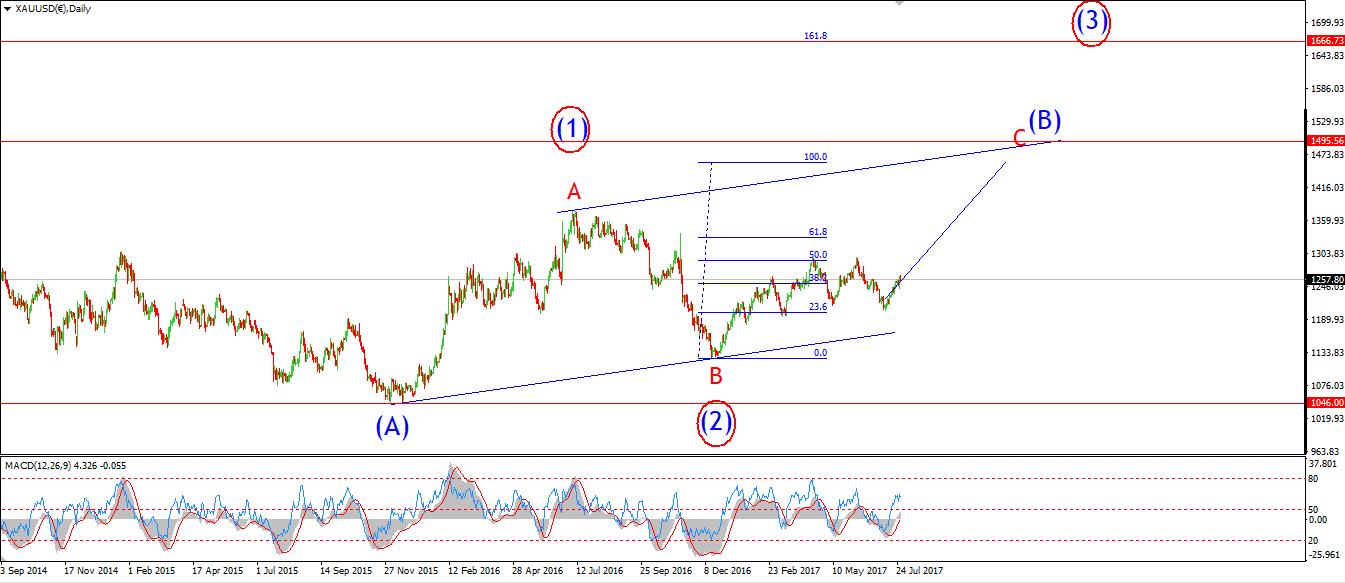
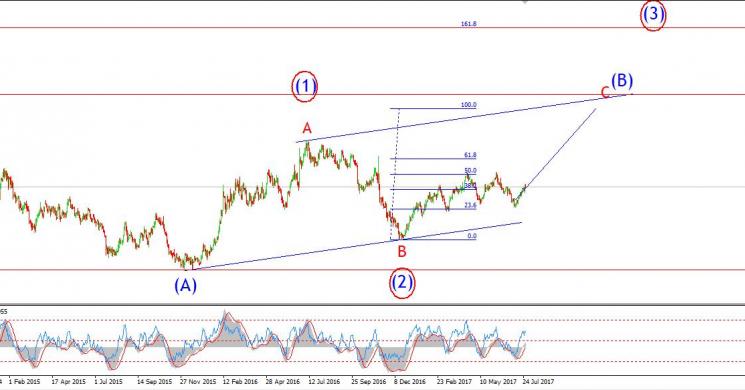
I have been examining the wave count on the daily chart over the last few days, And I think I am being conservative in both my wave count and the upper target. There is a very real possibility that the corrective phase in GOLD is complete at 1046. And that the market is gearing up for a new impulsive five wave rally to new all time highs. I have shown the alternate wave count as a (1) (2) pattern to the upside, And the price could be rising in wave (3) blue right now. The initial target for wave (3) blue is at 1666, Where the price hits the Fibonacci extension of wave (1) blue.
All shall be revealed in time, but this is one to watch.
Read more by Enda Glynn


