One of the major gold market indicators experienced a major shift in 2017. If we look at this gold indicator over the past several years, this recent trend reversal suggests something has fundamentally changed in the gold market… and in a BIG WAY.
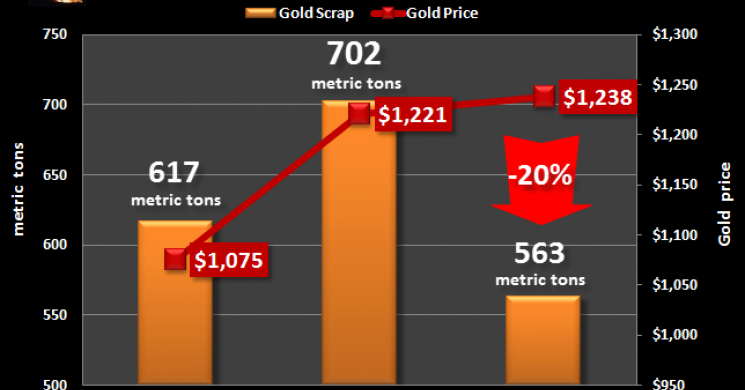
According to the World Gold Council, global gold scrap supply declined significantly during the first half of 2017 even though the price of gold increased. Global gold scrap supply plunged to 563 metric tons (mt) in the first half of 2017 compared to 702 mt during the same period last year:

Now, what is interesting about this decline in gold scrap supply is that it took place even though the gold price increased to $1,238 versus $1,221 during the same period last year. Normally, gold scrap supply increases with price. This actually took place when the price of gold increased from $1,075 in 1H 2015 to $1,221 during 1H of 2016. As the gold price jumped nearly $150 during this period, global gold scrap supply increased from 617 mt to 702 mt. Normally, when the gold price increases, individuals take advantage by selling old jewelry or scrap into the market.
However, this normal trend changed in 2017 as global gold scrap supply declined 20% to 563 mt, even as the gold price increased. This suggests that the market is now holding onto its gold rather than sell it into the market… even at higher prices.
While this recent negative shift in global gold scrap supply seems interesting when we look at the change over the past few years, it’s even more surprising when we go back to 2010. In 2010 when the price of gold was trading lower than the level today, global gold scrap supply was considerably higher. How much higher? Look at the chart below:

In 2010, the gold scrap market supplied 1,683 mt (54 million oz) into the market based on an average price of $1,224 for the year. That was a stunning 54 million oz additional gold supply into the market. While global gold scrap supply fluctuated along with price over the next six years, something seriously changed in 2017.
If we assume that in the second half of 2017 the market will supply about the same amount of gold scrap as in the first half, I estimate total global scrap supply will be 1,150 mt (37 million oz). Which means, as the price of gold has increased in 2017, global gold scrap supply will fall by almost a third, or 32% versus 2010.
This is a loss of 533 mt or 17 million oz of gold from the market, even though the price has risen from its low at the end of 2015. As I stated, this major gold market indicator trend shift suggests that individuals are now holding onto their gold rather than sell it for a higher FIAT MONETARY PRICE.
Furthermore, the declining amount of global gold scrap supply will put more pressure on the market going forward. For example, world gold scrap supply of 1,683 mt in 2010, accounted for 61% of global mine supply of 2,744 mt. This year, estimated gold scrap supply of 1,150 mt would only account for 35% of the 3,250 mt of forecasted world mine supply.
What a change in seven years. This falling gold scrap supply into the global market means any increase in demand will start putting a pressure on the price as the World Stock and Bond markets start to crack and rollover in the next few years. Ironically, we are actually seeing a surprising increasing of demand interesting sectors of the market.
While rapidly decline global gold scrap supply is a very POSITIVE indicator for the gold price in the future, there is another indicator that I is even more startling. I will be writing about this in a new article towards the end of the week.
Click here for original article
Read more by MarketSlant Editor


