With stock prices rocketing to all-time highs, investors are now looking for alternative assets to add to a balanced portfolio. Growth in the United States has notched up a back to back 3% gains, which will eventually increase inflation and buoy the precious metals complex. With this in mind, investors should focus on the best time to purchase silver coins and gold bars, looking to allocate capital to the precious metals complex. One way to evaluate when silver bars will head higher is to evaluate the seasonality of spot silver prices.
Growth is on the Rise
For the first time in the past several years, GDP has increased by 3% or more in back to back quarters. The increase in growth came despite a decline in commercial and residential investment due to Hurricanes Harvey and Irma. Consumption in the U.S. is on the rise, increasing during the last quarter by a robust 2.4% rate, and exports and imports increased more than expected. What is even more upbeat is the reversal in the weak inventory path that has been experienced over the past year. Overall U.S. GDP increased by 3.0% in in the third quarter following the 3.1% pace in the second quarter. This was the best back-to-back performance since the second and third quarters of 2014.
Seasonality of Silver
With continued growth on the horizon, and interest rates likely to climb, bullion products are a great way to add to an investment portfolio. The question is when should you purchase silver bars and gold coins. The answer is to look at the season tendencies of the spot price of silver or gold and use these long-term results to guide your investing criteria.
You can measure the seasonal tendencies of a precious metals by evaluating the returns they have exhibited for each month of the year over an extended period. You want to measure the returns that have occurred, and categorize those returns as either positive or negative (or zero). Once you due this you can look at the percent of time that the returns are positive relative to negative and on average how far the spot price moves during a month or quarter.
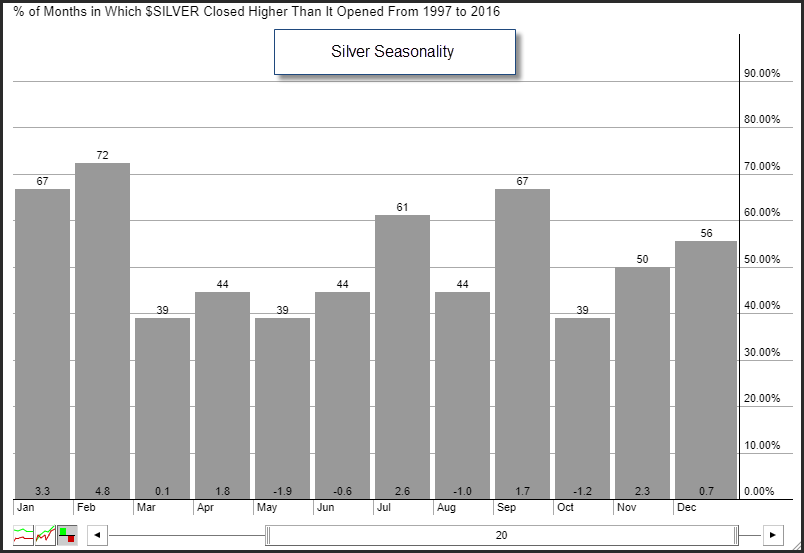
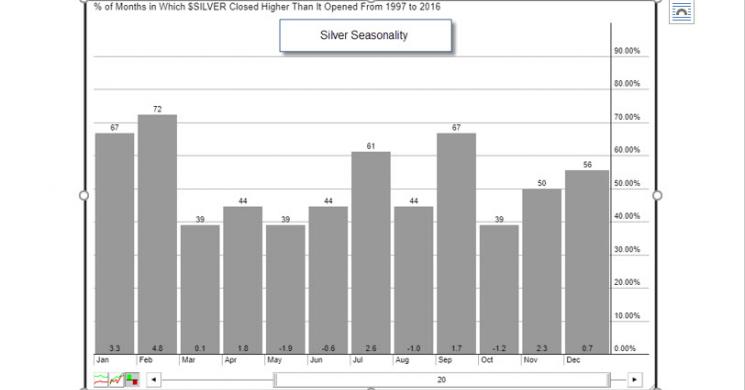
The chart above shows the seasonality of silver prices over the past 20-years. The chart shows you that over the next 4-months, which include November, December, January and February, the seasonal favor an upward bias toward the spot price of silver. While silver is up 50% of the time in November and 56% of the time in December, the average returns are 2.3% and 0.7% during these months. What is impressive is the 67% increase in January and 72% increase in February which shows average increases 3.3% and 4.8% respectively.
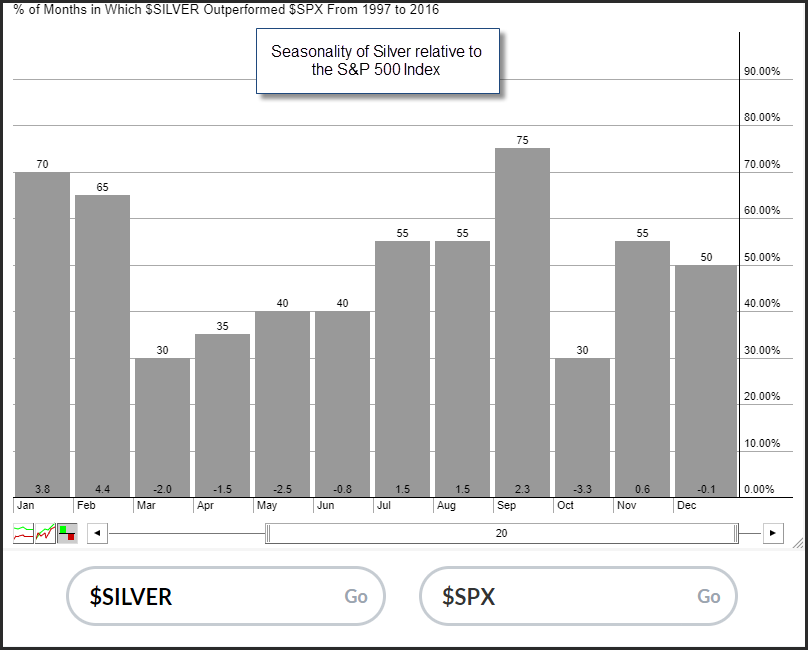
You can add to your analysis by looking at the relative returns of silver compared to the S&P 500 index. The seasonal profile shows that silver outperforms in November, slightly underperforms in December, and then heavily outperforms stocks prices in January and February by 70% and 65%, with an average outperformance of 3.8% and 4.4% respectively over the last 20-years.
While the timing of the outperformance can change year to year, the seasonal analysis of precious metals shows you that it’s time to buy silver bars or gold coins.
Good Investing,
Treasure Coast Bullion Group
Read more by Treasure Coast Bullion Group, Inc - Staff Writer


