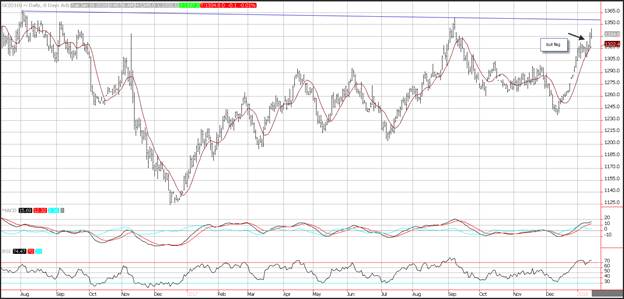
Gold prices broke out of a bull flag pattern, as the dollar moved lower paving the way for higher precious metal prices. Since gold prices are quoted in dollars and gold is traded like a currency, a weaker dollar portents higher gold prices. Target resistance is seen near a downward sloping trend line that connects the highs in July of 2016 to the highs in September of 2017 and comes in near 1,353. Support on gold prices is seen near the 10-day moving average near 1,322.
Gold Price Chart

Momentum remains positive as the MACD (moving average convergence divergence) histogram, which is a momentum indicator, is printing in the black with an upward sloping trajectory which points to higher prices for the yellow metal.
The relative strength index (RSI) is key to the next breakout and will describe momentum as prices attempt to push through trend line resistance. Bulls should expect a fresh high in the RSI, reflecting accelerating positive momentum. Beware of a divergence, where prices continue to move higher while the RSI does not. A divergence could foreshadow a fake out instead of a breakout. The RSI remains in overbought territory as it has pierced through the 70 level, which could foreshadow a temporary correction in gold prices.
Silver Price Chart

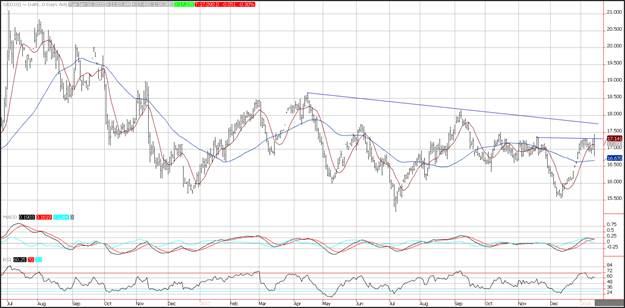
Silver prices continue to form a bull flag pattern, but Tuesday’s price action is less than favorable. Prices attempted to break out and were rejected, and a close near the lows would represent a outside day which generally signals a correction. Silver is still forming a bull flag pattern which is a pause that refreshes higher. Resistance is seen near the November highs at $17.39. The next level of target resistance for silver prices is a downward sloping trend line that is generated by connecting the highs in April 2017 to the highs in September 2017 and comes in near $17.75. Support on silver bullion prices is seen near the 10-day moving average at $17.14. Additional support is seen near the 50-day moving average at 16.67.
Momentum has turned neutral as prices have consolidated. The MACD (moving average convergence divergence) histogram is printing near the zero-index level with a flat trajectory which reflects consolidation. The RSI in January tested the overbought trigger level of 70, and since has meandered lower, which reflects decelerating positive momentum.
Spread Between Gold and Silver Chart

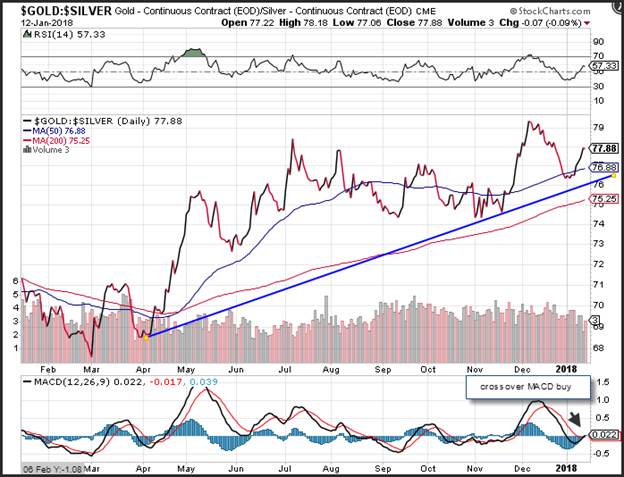
The rebound in the ratio of gold bar prices and silver bullion places the ratio higher on the year after consolidating below the 50-day moving average early in January. This means that gold prices are outperforming silver prices. The ratio sliced through prior resistance now support near the 50-day moving average at 76.88. Additional support is seen near an upward sloping trend line that comes in near 76.
Momentum on the ratio has turned positive which is a good sign for those who believe gold bullion will continue to outperform. The MACD (moving average convergence divergence) generated a crossover buy signal as the MACD line (the 12-day moving average minus the 26-day moving average) crosses above the MACD signal line (the 9-day moving average of the MACD line). The MACD histogram is now printing in the black with an upward sloping trajectory and combined with the recent MACD buy signal points to a higher ratio.
Read more by Treasure Coast Bullion Group, Inc - Staff Writer


