- Gold Prices Pause as the Dollar Strengthens
- Silver Prices Continue to Form Continuation Pattern
- Silver Prices Outperformed Gold prices in the Latest Week
Gold prices are taking a temporary respite, as they failed to hold above resistance, generating a failed breakout at the end of last week. President’s Donald Trump’s positive comments about the U.S. dollar, seemed to buoy the greenback late in the week, generating headwinds for gold prices. Since gold is priced in dollars a stronger dollar makes gold prices more expensive in other currencies which in turn puts pressure on gold prices to normalize lower.
After breaking out on Thursday last week, and closing at fresh 18-months highs, prices reversed course on Friday and closed on resistance levels which was created from a downward sloping trend line that connects the highs in July of 2016 to the highs in September of 2017 and comes in near 1,352. If prices can recapture this level, the current breakout remains intact. A daily close below this level could foreshadow a short-term cap in gold bullion prices. Short-term support is seen near the 10-day moving average at 1,341. A close below this level could lead to a test of the January lows at 1,308.
Gold Price Chart
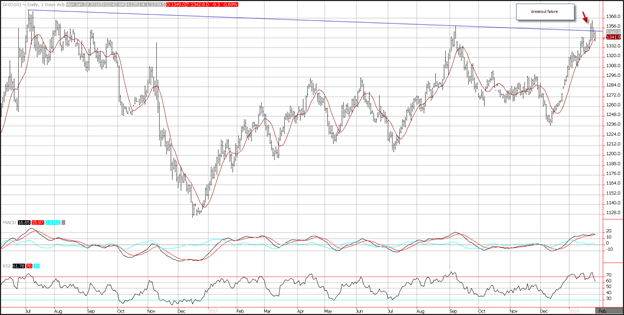
Momentum is now neutral and potentially turning negative. The MACD histogram is now printing near the zero-index level with a flat trajectory which points to consolidation. The MACD line is poised to generate a sell signal as it is fast approaching the MACD signal line which would generate a crossover sell signal.
The relative strength index (RSI) has formed a triple top which reflects decelerating positive momentum and potentially accelerating negative momentum. The current reading of 61.7, has created sideways prints for the RSI and a close below 60 would reflect accelerating negative momentum.
Silver Price Chart

Silver bullion futures prices also broke out on Thursday last week and were also rejected, forming a false breakout. Silver bar prices are still forming a reverse head and shoulder pattern, and as long as prices hold trend line support seen near 16.90, the pattern will remain in place. Short term support on silver bullion prices is seen near the 10-day moving average at 17.20. Resistance is seen near the January highs at 17.70.
Momentum has turned neutral as prices have consolidated. The MACD (moving average convergence divergence) histogram is printing near the zero-index level with a flat trajectory which reflects consolidation. The RSI is moving sideways reflecting neutral momentum, as it prints a reading of 56, which is in the middle of the neutral range and reflects consolidation.
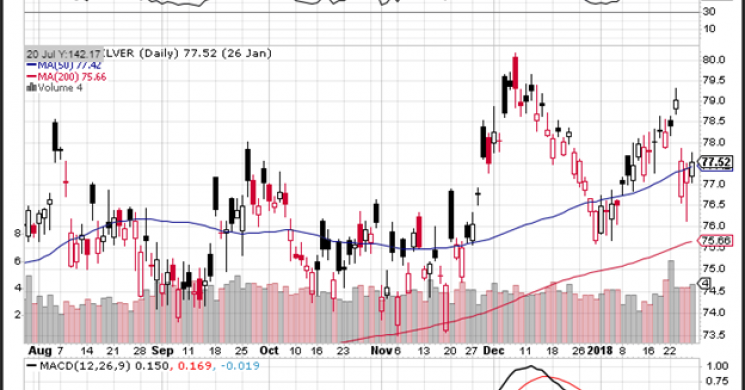
Spread Between Gold and Silver Chart
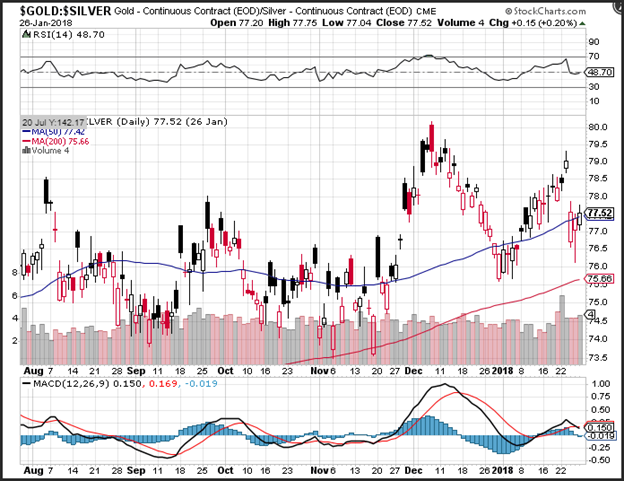
Silver prices surged relative to gold prices last week, which is reflected in the gap lower in the price of the ratio between gold bullion and silver bullion. The ratio declined nearly 2% since it hit a high last Wednesday. The spread seems to be hovering near the 50-day moving average at 77.50. The latter part of the week will provide many economic data points which will go a long way in describing how this spread will move. Stronger than expected growth will help buoy silver bullion prices relative to gold bullion prices.
Momentum on the ratio has turned negative which is a good sign for those who believe silver bullion will start to outperform gold. The MACD (moving average convergence divergence) generated a crossover sell signal as the MACD line (the 12-day moving average minus the 26-day moving average) crosses below the MACD signal line (the 9-day moving average of the MACD line). The MACD histogram is now printing in the red with a downward sloping trajectory which points to silver prices outperforming gold prices.
Good Investing,
Treasure Coast Bullion Group
Read more by Treasure Coast Bullion Group, Inc - Staff Writer


