
Volatility has returned to the capital markets especial for riskier assets such as equities which underlies the reason investor should diversify their portfolios with gold bullion and silver bars. The weekly chart of gold prices gives us a broader view allowing you to see the forest through the trees.
Gold prices are consolidating at the top end of a recent range after rebounding from the October lows near $1,260 per ounce. Gold bullion prices have been unable to pierce through resistance near the January highs at $1,365 per ounce. While inflation is finally beginning to perk up, gold will initially not respond to this impetus unless is accompanies by a weaker dollar.
Its been only 2-weeks since gold bullion prices peaked, but a downward sloping trend line that connects the highs in July of 2016 to the highs in July 2017 held, as gold bullion prices were unable to exceed this level on a closing basis.
You can also see that gold has more work to due to break out of a long-term range near the 38.2% Fibonacci retracement of the decline from the highs in September 2011, to the lows made in December 2014 near 1,046. This Fibonacci retracement level comes in near $1,378 which has held 3-times already since the huge decline in gold bullion prices that ensued following the rise in the greenback.
Gold Price Chart
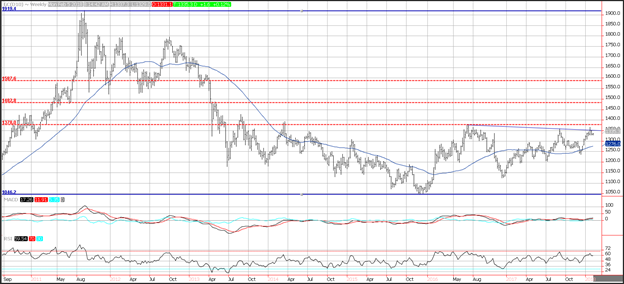
Momentum is now neutral and potentially turning negative. The MACD histogram is now printing near the zero-index level with a flat trajectory which points to consolidation.
The relative strength index (RSI) has formed a triple top which reflect decelerating positive momentum and potentially accelerating negative momentum. The current reading of 59.54, was created from sideways price action which also reflects consolidation.
Silver Price Chart
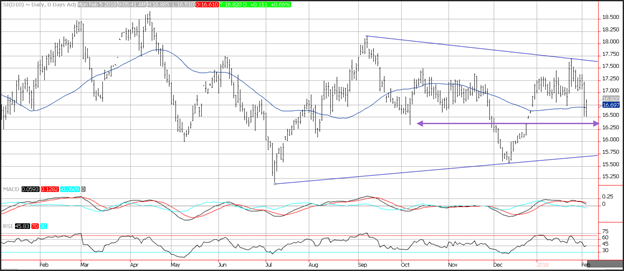
Silver bullion daily futures prices are more interesting to look at relative to their weekly counterpart. The weekly chart shows that prices are rangebound and have not come close to exiting the 3-year highs at $21.10 and the 3-year lows at $13.75. The daily chart of silver bullion futures shows that prices rebounded on Monday after closing at the 50-day moving average. Support is seen near an upward sloping trend line that connects the lows in July 2017 to the lows in December of 2017 and comes in near 15.70. Resistance is seen near a downward sloping trend line that connects the highs in September of 2017 to the highs in January of 2018 and comes in near $17.62.
Momentum has turned negative as the MACD (moving average convergence divergence index recently generated a crossover sell signal. The MACD histogram is printing in the red with a downward sloping trajectory which points to lower prices.
Spread Between Gold and Silver Chart
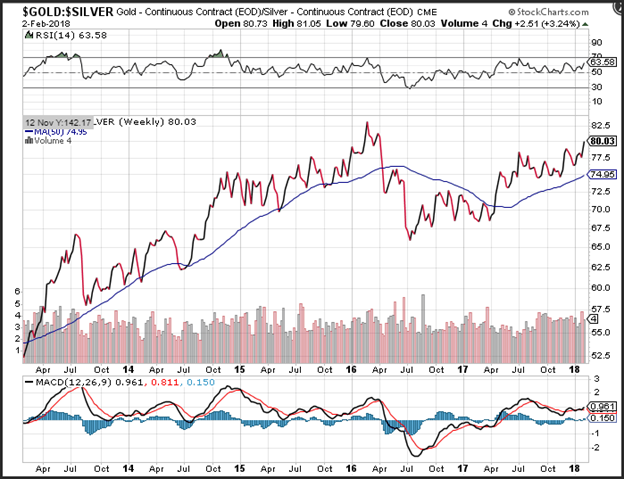
The drop-in gold prices late last week, was eclipsed by the drop-in silver prices allowing the ratio between gold and silver to break out on a weekly chart. The technical picture of gold bars versus silver bar is positive, as prices are now poised to test the 2016 highs near 83. Support on the ratio between silver and gold is seen near the 50-week moving average at 74.95.
Momentum on the ratio on a weekly basis has turned positive as the MACD (moving average convergence divergence) generated a crossover buy signal. This occurs as the MACD line (the 12-week moving average minus the 26-week moving average) crosses below the MACD signal line (the 9-week moving average of the MACD line). The MACD histogram is now printing in the black with a upward sloping trajectory which points to gold outperforming silver.
Good Investing,
Treasure Coast Bullion Group
Read more by Treasure Coast Bullion Group, Inc - Staff Writer


