Monday’s monster stock selloff is exhibit A for why I frequently recommend a 10 percent weighting in gold, with 5 percent in bullion and jewelry, the other 5 percent in high-quality gold stocks, mutual funds and ETFs.
What began on Friday after the positive wage growth report extended into Monday, with all major averages dipping into negative territory for the year. The Dow Jones Industrial Average saw its steepest intraday point drop in history, losing nearly 1,600 points at its low, while the CBOE Volatility Index, widely known as the “fear index,” spiked almost 100 percent to hit its highest point ever recorded.
Gold bullion and a number of gold stocks, however, did precisely as expected, holding up well against the rout and helping savvy investors ward off even more catastrophic losses. Klondex Mines and Harmony Gold Mining, among our favorite small-cap names in the space, ended the day up 4.6 percent and 4.8 percent, respectively. Royalty company Sandstorm Gold added 1.4 percent.
The research backs up my 10 percent weighting recommendation. The following chart, courtesy of BCA Research, shows that gold has historically outperformed other assets in times of geopolitical crisis and recession. Granted, the selloff was not triggered specifically by geopolitics or recessionary fears, but it’s an effective reminder of the low to negative correlation between gold and other assets such as equities, cash and Treasuries.
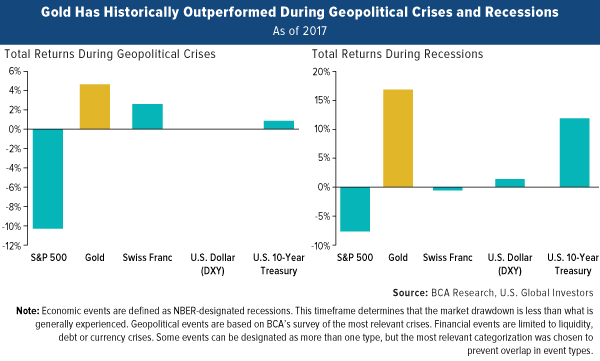 “We expect gold will provide a good hedge against a likely equity downturn, as the bull market turns into a bear market” in the second half of 2019, BCA analysts write in their February 1 report.
The reemergence of volatility and fear raises the question of whether we could find ourselves in a bear market much sooner than that.
So how did we get here, and what can we expect in the days and weeks to come?
Gold Has Helped Preserve and Grow Capital in Times of Rising Inflation
It’s important to point out that the U.S. economy is strong right now, so the selloff likely had little to do with concerns that a recession is near or that fundamentals are breaking down. The Atlanta Federal Reserve is forecasting first-quarter GDP growth at 5.4 percent—something we haven’t seen since 2006. And FactSet reports that S&P 500 earnings per share (EPS) estimates for the first quarter are presently at a record high. A correction after last year’s phenomenal run-up is healthy.
Several factors could have been at work, including algorithmic and high-frequency quant trading systems that appear to have made the call Monday that it was a good time to take profits. Other investors seemed to have responded to Friday’s report from the Labor Department, which showed that wages in December grew nearly 3 percent year-over-year, their fastest pace since the financial crisis. This is a clear sign that inflationary pressure is building, raising the likelihood that the Federal Reserve will hike borrowing costs more aggressively than some investors had anticipated.
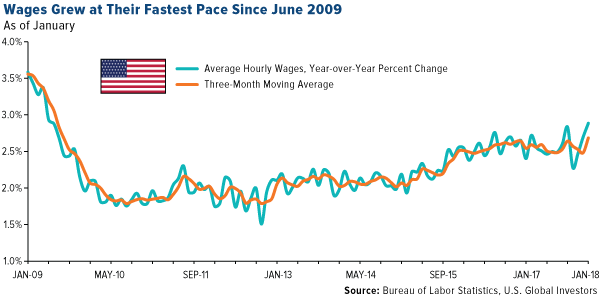 As I’ve explained many times before, gold has historically performed very well in climates of rising inflation. When the cost of living heats up, it eats away at not only cash but also Treasury yields, making them less attractive as safe havens. Gold demand, then, has surged in response. This is the Fear Trade I talk so often about.
But which measure of inflation is most accurate? The Fed’s preferred gauge, the consumer price index (CPI), rose 2.1 percent year-over-year in December. Then there’s the New York Fed’s recently launched Underlying Inflation Gauge (UIG), which claims to forecast inflation better than the CPI by taking into consideration a “broad data set that extends beyond price series to include the specific and time-varying persistence of individual subcomponents of an inflation series.” The UIG rose nearly 3 percent in December. And finally, the alternate CPI estimate, which uses the official methodology before it was revised in 1990, shows that inflation could be closer to 10 percent.
Whichever one you choose to look at, though, they all indicate that inflation is trending up.
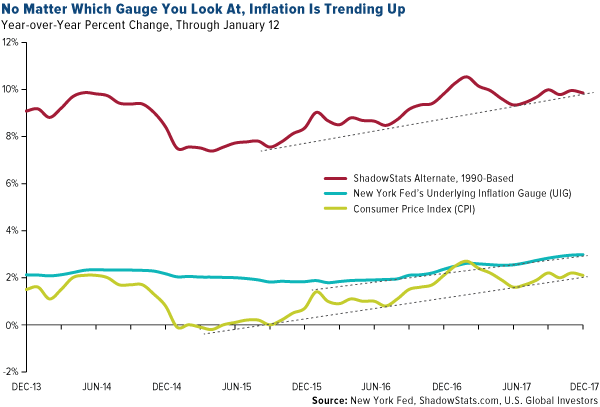 Making predictions is often a fool’s game, but I believe that after lying dormant for most of this decade, inflation could be gearing up for a resurgence on higher wages and borrowing costs. Now might be a good time to rebalance your gold holdings to ensure a 10 percent weighting.
“This pick-up in inflation and inflation expectations is positive for gold,” says BCA, “which we’ve shown to be an attractive hedge against rising prices.”
Long-Standing History of Performance
Besides being favored as a safe haven in times of crisis, gold has a history of attractive performance over the long term. Compared to many other asset classes, the yellow metal has been very competitive in multiple time periods.
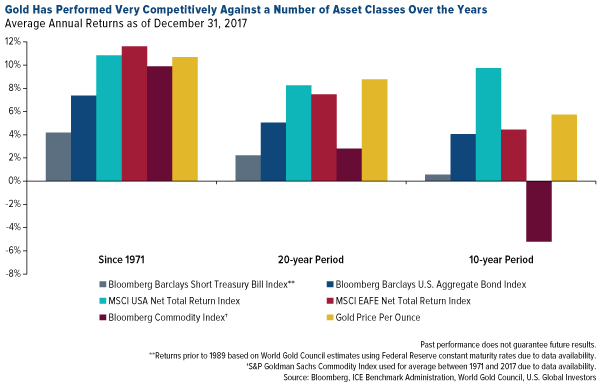 Since 1971, when President Richard Nixon finally took the U.S. off the gold standard, gold has outperformed all asset classes except domestic and international equities, as of December 31, 2017. In the 20-year period, gold crushed domestic and foreign stocks, bonds, cash and commodities. Most impressive is that, in every period measured above, the precious metal has beaten cash, bonds and commodities.
Having a 5 to 10 percent weighting in gold and gold stocks during these periods could have helped investors minimize their losses in other asset classes.
To learn more about gold’s role in times of rising inflation, click here.
All opinions expressed and data provided are subject to change without notice. Some of these opinions may not be appropriate to every investor. By clicking the link(s) above, you will be directed to a third-party website(s). U.S. Global Investors does not endorse all information supplied by this/these website(s) and is not responsible for its/their content.
The Dow Jones Industrial Average (DJIA) is a price-weighted average of 30 significant stocks traded on the New York Stock Exchange (NYSE) and the NASDAQ. The DJIA was invented by Charles Dow back in 1896. The CBOE Volatility Index, known by its ticker symbol VIX, is a popular measure of the stock market's expectation of volatility implied by S&P 500 index options, calculated and published by the Chicago Board Options Exchange (CBOE). It is colloquially referred to as the fear index or the fear gauge. The Standard & Poor's 500, often abbreviated as the S&P 500, or just the S&P, is an American stock market index based on the market capitalizations of 500large companies having common stock listed on the NYSE or NASDAQ. The S&P 500 index components and their weightings are determined by S&P Dow Jones Indices. The Bloomberg Barclays Short Treasury Bill Index tracks the market for Treasury bills issued by the U.S. government. U.S. Treasury bills are issued in fixed maturity terms of 4-, 13-, 26- and 52-weeks. The Bloomberg Barclays US Aggregate Bond Index, which until August 24, 2016 was called the Barclays Capital Aggregate Bond Index, and which until November 3, 2008 was called the "Lehman Aggregate Bond Index," is a broad base index, maintained by Bloomberg L.P. since August 24, 2016, and prior to then by Barclays which took over the index business of the now defunct Lehman Brothers, and is often used to represent investment grade bonds being traded in United States. The MSCI USA Net Total Return Index is a market capitalization weighted index designed to measure the performance of equity securities in the top 85% by market capitalization of equity securities listed on stock exchanges in the United States. The MSCI EAFE Net Total Return Index is a stock market index that is designed to measure the equity market performance of developed markets outside of the U.S. & Canada. It is maintained by MSCI Inc., a provider of investment decision support tools; the EAFE acronym stands for Europe, Australasia and Far East. The Bloomberg Commodity Index (BCOM) is a broadly diversified commodity price index distributed by Bloomberg Indexes. The index was originally launched in 1998 as the Dow Jones-AIG Commodity Index (DJ-AIGCI) and renamed to Dow Jones-UBS Commodity Index (DJ-UBSCI) in 2009, when UBS acquired the index from AIG. The S&P GSCI (formerly the Goldman Sachs Commodity Index) serves as a benchmark for investment in the commodity markets and as a measure of commodity performance over time. It is a tradable index that is readily available to market participants of the Chicago Mercantile Exchange.
The consumer price index (CPI) is an index of the variation in prices paid by typical consumers for retail goods and other items. The Underlying Price Gauge (UIG) captures sustained movements in inflation from information contained in a broad set of price, real activity, and financial data.
Holdings may change daily. Holdings are reported as of the most recent quarter-end. The following securities mentioned in the article were held by one or more accounts managed by U.S. Global Investors as of 12/31/2017: Klondex Mines Ltd., Kirkland Lake Gold Ltd., Sandstorm Gold Ltd.
U.S. Global Investors, Inc. is an investment adviser registered with the Securities and Exchange Commission ("SEC"). This does not mean that we are sponsored, recommended, or approved by the SEC, or that our abilities or qualifications in any respect have been passed upon by the SEC or any officer of the SEC.
This commentary should not be considered a solicitation or offering of any investment product.
Certain materials in this commentary may contain dated information. The information provided was current at the time of publication.
Read more by Frank Holmes


