Recent news about the US and China posturing for Trade Deals and the continued increase in rhetoric has weighed heavily on the markets these past few weeks. Yes, trade issues are a concern for nations and fair trade is essential to support both economies. Yet, the news seems to be exaggerated in scale and scope when one considers the totality of it all. Our research team at Technical Traders Ltd. as recently completed a detailed analysis of the Chinese economy including a study of the expected pressures that are mounting throughout most of China/Asia. A property market cycle, extended debt issues, foreign capital projects, military tensions and now “trade tariffs” are adding up to quite a bit of headwind for the Chinese.
As we discussed in an article last year, we believe capital is like a living organism – always attempting to migrate to sources of better return, less risk and a more healthy environment for success. We believed, at the time of that article, that capital would migrate into the US because of the recent election of a new US President and because of the multiple deregulations and pro-business steps taken by the new US President. At the same time, in 2016/2017, we were keenly aware of a broader market cycle that had been setting up with regards to the early stage price advances throughout 2017.
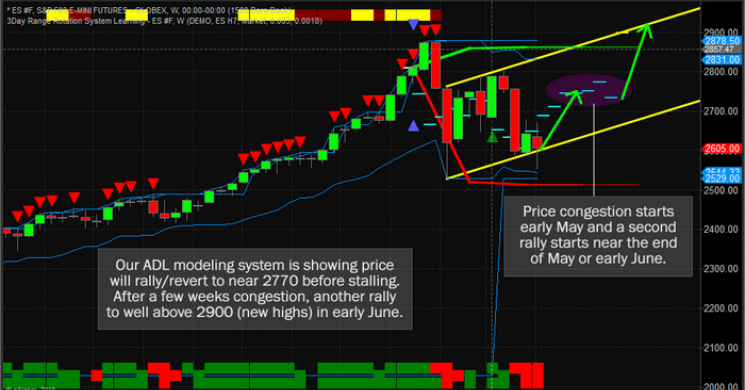
Somewhat similar, we now believe the trade issues in conjunction with economic cycle issues, that are playing out as we write this article, will coincide to drive capital away from riskier environments and, again, towards the US as a “safe haven” investment. We believe this will drive another wave of upward pricing pressure over the next 2~3 months starting with an early stage price rotation in the ES to near 2770.
Take a look at this ES chart with our Adaptive Dynamic Learning modeling system at work. This modeling system is one of the tools we use to help us understand and predict future price moves by asking it to scan and research the highest probability outcomes for the price in the future. One can clearly see the upward price channel, drawn in YELLOW, as a key source of price boundaries. One can also clearly see the ADL predictive learning model showing prices should advance throughout early April to near 2770, then stall near this level for a period of about 3~4 weeks (we expect early/mid May), before another massive advancement in price starts near the end of May or early June. This later stage advancement appears to predict “new highs” set in early June 2018.
Therefore, we are advancing the analysis that this recent news about technology issues (Facebook and others) in addition to the trade issues and comments between China and the US are nothing more than a distraction from the reality that we are discussing multiple nations, multi-trillion dollar economies and billions of global consumers. In a worst-case scenario, certain products and raw materials will cost a bit more over a period of time. These costs will be absorbed into the general economies and consumer costs over time. Over time, traders will come to understand this as an opportunity to take advantage of depressed pricing.

As we apply the same type of ADL price prediction to the NQ, we can see similarities in price setup and advancement. Additionally, we have added a time cycle component to this chart that helps to identify price rotation levels, cycle bottoms, and tops. One can clearly see we have recently passed a massive cycle bottom formation where price rebounded off of the lower price channel.
Additionally, a longer-term price cycle bottom formed in early March. This longer-term price cycle rotation is indicating we should see prices advance through April and May before reaching a peak in the middle of June (sometime). The further out we attempt to predict price peaks and troughs, the vaguer the timeline analysis becomes. We can attempt to predict an immediate price advance simply because the time cycles and ADL price predictions are showing us that price is currently below ADL predicted levels and the predicted levels are moving higher. This tells us that price should rebound from this lower price channel very quickly in an attempt to “re-balance” with expected price levels.

One key element has been added to this next chart, the downward price channel that is currently containing price advancement. Once this level is breached, we believe the move higher will be aggressive and sustained. All of this analysis coincides with a number of factors that play into our analysis. We believe that capital will continue to migrate into the US as a safe haven from foreign market crisis events. We believe that China/Asia are on the cusp of a potential asset/general market downturn. We believe that other nations will experience a “ripple effect” from the China/Asia rotation that we are predicting. And we believe these events will drive further investment into the US markets and equities as a source of continued returns.

Overall, we do believe that at some point in the near future the US market will experience a massive price rotation that will begin a new bear market – but we don't believe that is happening right now. As you can see from the chart, above, we have indicated that “Caution Below This Level” would be an early warning signal that a deeper price rotation may be set up. As long as the price stays within this major upward price channel, we should see a mean price reversion to the projected levels and if our ADL predictions hold true, we will likely see new price highs before the end of June 2018.
If you want to learn more about our research team, specialized tools for traders and how we can assist you in taking advantage of these price swings, please visit www.TheTechnicalTraders.com to learn more and to read our previous research articles. We offer daily videos, commentary, trading signals and more to our members to assist them in profiting and preparing for these future market moves. Our advanced technologies provide us a unique view into the future. If you want access to our powerful tools and to become a profitable technical trader, then please visit www.TheTechnicalTraders.com to see how accurate our technology has called all of 2018 – almost to the exact day of many price tops and bottoms.
GET OUR TRADES NOW!
Read more by TheTechTrader


