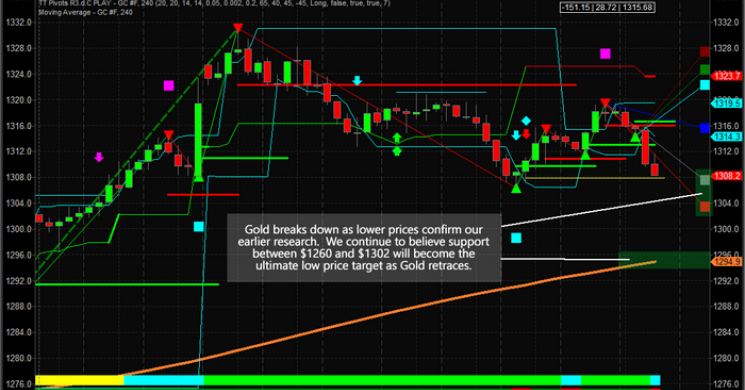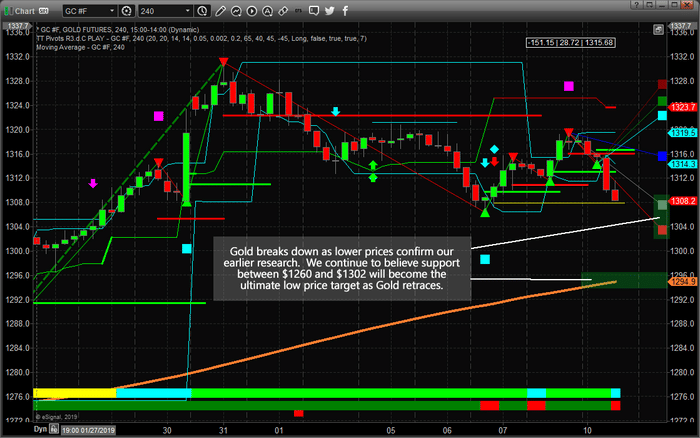
On January 28, 2019, our research team issued a research post indicating we believed that Precious Metals would rotate lower over the next 45+ days in preparation for a momentum base/breakout that would initiate sometime near the end of April or early May. Recent price weakness in Gold has begun to confirm our analysis and we believe this price weakness will continue for the next 2~4 weeks while traders identify a price bottom and hammer out a momentum base/support level.
Gold is currently down another -1% this week and testing the $1307 level after rotating back to near $1320. Our analysis continues to suggest price weakness in the Precious Metals markets going forward for at least 2~3 more weeks. We are expecting the price of Gold to fall below $1290 and ultimately, potentially, test the $1260 level where we believe true support will be found.
If you've been following our analysis, you were alerted the day of when we signaled the top as it formed near $1330 and to close out our GDXJ position for a quick 10.5% profit as we had been preparing for this top and rotation for a couple weeks.
This 240-minute Gold chart highlights our Adaptive Fibonacci price modeling system and suggests the $1295~1302 could become immediate support for this current downside price move.

Please take a minute to review some of our most recent research by visiting www.TheTechnicalTraders.com/FreeResearch/ and to learn why our team of researchers, software developers, and traders provide insight and knowledge that you just can't get anywhere else on the planet. The link to our research post, above, highlights our ADL predictive modeling system that is capable of identifying price moves many months in advance. Our most recent US stock market forecast highlights the power and capabilities of our proprietary price modeling tools. As a member of our newsletter, you gain insights, training, daily market videos and many more resources that will help you identify and execute for greater success in 2019.
Chris Vermeulen Technical Traders Ltd.


