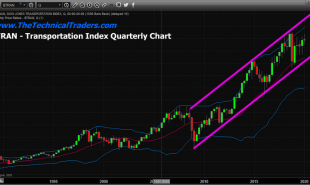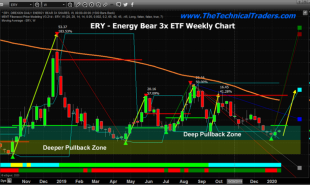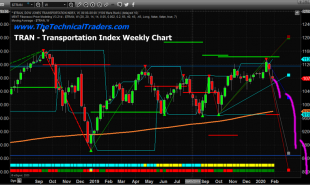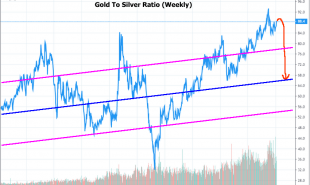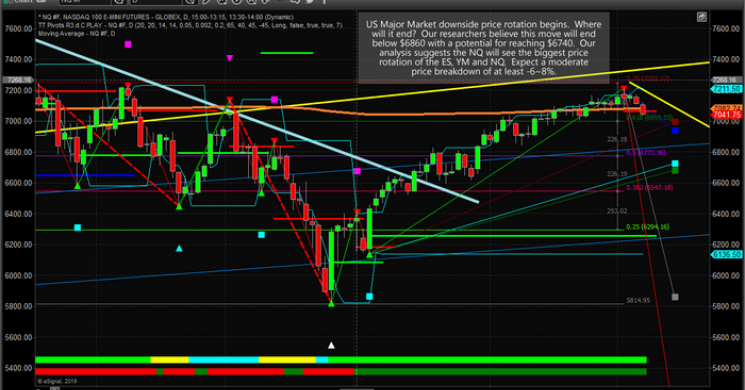
Our researchers have been working overtime trying to help you stay ahead of these market moves. You may recall that we called this current downward price rotation in the US stock market over 25 days ago? You may recall that we called the downside price move in Gold over 40 days ago? Now, we're going to help you understand how to find profits from these movements and how to look for opportunities throughout this rotation.
Our expectations for this move are that the NQ will see the biggest price rotation compared to the ES and YM. We expect the ES and YM to rotate downward by about -4~8% while we expect the NQ to rotate downward by -6~12%. The reason for this is that we believe investors are already in the midst of a capital shift moving capital away from technology and into Blue Chips and Mid-Caps. We believe this transition away from technology will continue and we believe this price weakness may result in the NQ/Technology establishing much lower price levels than many expect.
Currently, our expectations are for support near $6860 to hold with a potential for prices to reach a lower support level near $6740. We do expect this downside move to last at least 2~3 weeks before setting up a “momentum base” and starting to move higher again.

Opportunities currently exist for skilled traders to play this downside move in technology as well as to play an upside pop in the Inverse ETFs related to technology and the NASDAQ. Additionally, a similar trade could be made in the ES & YM, although we must warn you that price moves in the ES & YM are expected to be much more shallow in nature.
Our research suggests a bottom may form from this move sometime near April 10~17, 2019. We believe this rotation may last at least 3~4 weeks as expectations of global markets may continue until Brexit, US/China Trade and or Q1 Earnings start to hit the markets near the April 10~17 dates.
Once we enter April and get past April 5th or so, we should switch gears and start to look for Buying opportunities in the ES, YM, and NQ with a bias towards the Blue Chips and Mid-Caps. We believe these will be the bigger upside winners over the next 3~6+ months and could show an incredible upside price move after this new “momentum base” completes.
It is very important to take a minute to view our 5 PART Series because it shows you predicted price levels going all the way into 2021 and highlights why this “new bull market” may just be getting started.
If you want to join a group of professional traders, researchers, and friends, take a look at our trading newsletter to learn how we can help you find and execute better trades each month. We believe 2019 and 2020 will be incredible years for skilled traders and we are executing at the highest level we can to assist our members. In fact, we are about to launch our newest technology solution to better assist our members in creating future success.
Our team has 53 years of experience in researching and trading makes analyzing the complex and ever-changing financial markets a natural process. We have a simple and highly effective way to provide our customers with the most convenient, accurate, and timely market forecasts available today. Our stock and ETF trading alerts are readily available through our exclusive membership service via email and SMS text. Our newsletter, Technical Trading Mastery book, and 3 Hour Trading Video Course are designed for both traders and investors. Also, some of our strategies have been fully automated for the ultimate trading experience.
RECENT CLOSED TRADES
Chris Vermeulen Technical Traders Ltd.
Read more by TheTechTrader


