1. Goodbye, Iran Oil Import Waivers. Hello, Higher Energy Prices?
Besides Occidental Petroleum’s bidding war with Chevron for fellow producer Anadarko Petroleum, the big energy news from last week is that President Donald Trump, as expected, moved to end all sanction waivers for nations that import Iranian oil. Starting in May, countries that still buy oil from Iran could face U.S. penalties. In response, Brent crude hit $75 per barrel for the first time in six months.
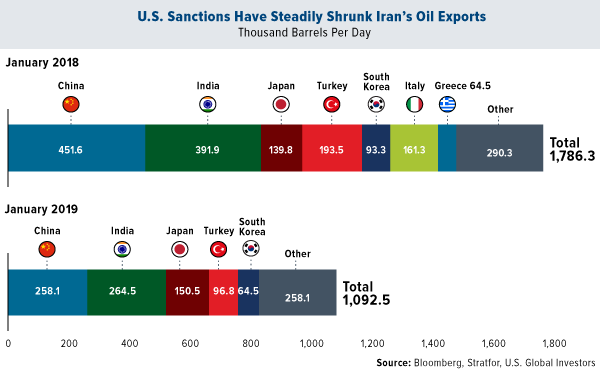
Oil and natural gas are the Middle Eastern country’s most important export, so the policy is intended to hit Tehran where it hurts. The plan, announced last summer, appears to be working so far. Between January 2018 and January 2019, Iranian oil exports fell by nearly 700,000 barrels per day (b/d). (The data could be inaccurate, though, since Iranian oil tankers are believed to be turning off their transponders in an effort to conceal themselves from satellite tracking systems.)
It’s unlikely that all countries will immediately zero-out imports from Iran. I would be surprised to see China, the number one consumer, trim its imports much further. Iran is such a key strategic player connecting Asia and the Middle East as part of China’s Belt and Road Initiative (BRI).
So who will pick up the global slack if Trump’s plan succeeds and Iranian exports go offline? Trump suggests Saudi Arabia and the United Arab Emirates (UAE) will. Secretary of State Mike Pompeo also believes the U.S. can, but this would “be a stretch,” according to Bloomberg.
“Oil condensate from the Eagle Ford shale basin in Texas is similar, though a bit heavier than Iran’s light South Pars condensate. But the Eagle Ford produces only about 150,000 b/d of its product, compared with Iran’s daily output of 600,000 barrels in 2017,” the article reads.
2. U.S. Crude Inventories Climb More Than Expected
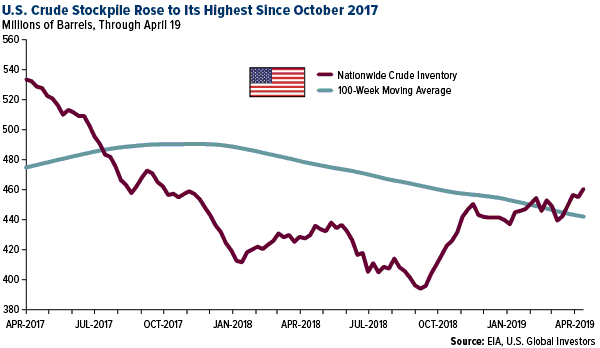
But maybe there’s something to what Pompeo says after all. Thanks to its fracking industry, the U.S. is producing oil at a breakneck pace. This is turning up in domestic inventories, which have been building steadily over the past seven months or so. For the week ended April 19, oil stocks rose by 5.5 million barrels, much more than what analysts had anticipated. At 460 million barrels, total crude stocks now sit at their highest level since October 2017.
The U.S. is already the biggest oil producer in the world, having overtaken Saudi Arabia and Russia last year. Looking ahead, U.S. output could equal that of both countries by 2025, according to International Energy Agency (IEA) estimates. And in January, the Department of Energy said that the U.S. will become a net exporter of energy in 2020—something it hasn’t achieved in almost 70 years.
3. Oil Prices Were Headed for Overbought Territory… Until Trump Stepped In
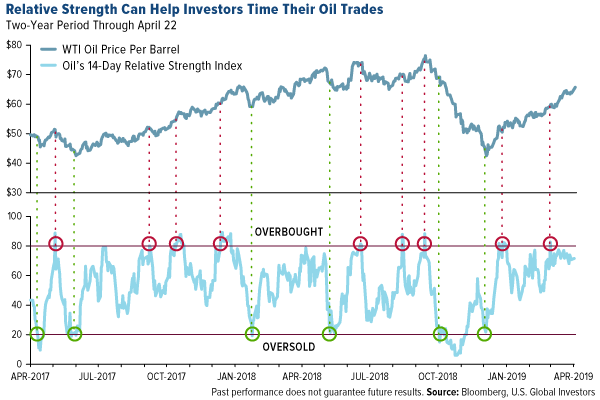
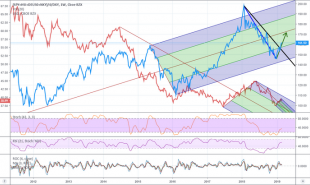
Oil prices neared overbought territory, as you can see in the chart below, which shows oil’s 14-day relative strength index (RSI). When an asset’s RSI rises above 80, it typically means that it’s overbought, suggesting it might be time to take some profits. When it falls below 20, meanwhile, it often means that the asset is oversold, signaling a possible entry point.
Again, oil prices looked to be on the overbought side, especially after the administration announced the end to sanction waivers. But the trend could reverse very rapidly.
Case in point: On Friday, the president, who favors lower energy costs, claimed that he “called up” OPEC and told the global oil exporting cartel: “You’ve got to bring [gasoline prices] down, you’ve got to bring them down.” Which, of course, is not in Saudi Arabia’s best interest.
In any case, the price of West Texas Intermediate (WTI) plunged close to 4 percent on Friday, its biggest one-day drop since mid-December. As a result, oil’s RSI sharply turned down to around 50, from nearly 72 on Monday.
Depending on what happens in the next few days, oil traders might be looking at another buying opportunity.
Get even more award-winning market commentary by subscribing to my CEO blog Frank Talk!
--
All opinions expressed and data provided are subject to change without notice. Some of these opinions may not be appropriate to every investor. Some links above may be directed to third-party websites. U.S. Global Investors does not endorse all information supplied by these websites and is not responsible for their content.
The relative strength index is a technical indicator used in the analysis of financial markets. It is intended to chart the current and historical strength or weakness of a stock or market based on the closing prices of a recent trading period.
Holdings may change daily. Holdings are reported as of the most recent quarter-end. None of the securities mentioned in the article were held by any accounts managed by U.S. Global Investors as of 3/31/2019.
Read more by Frank Holmes


